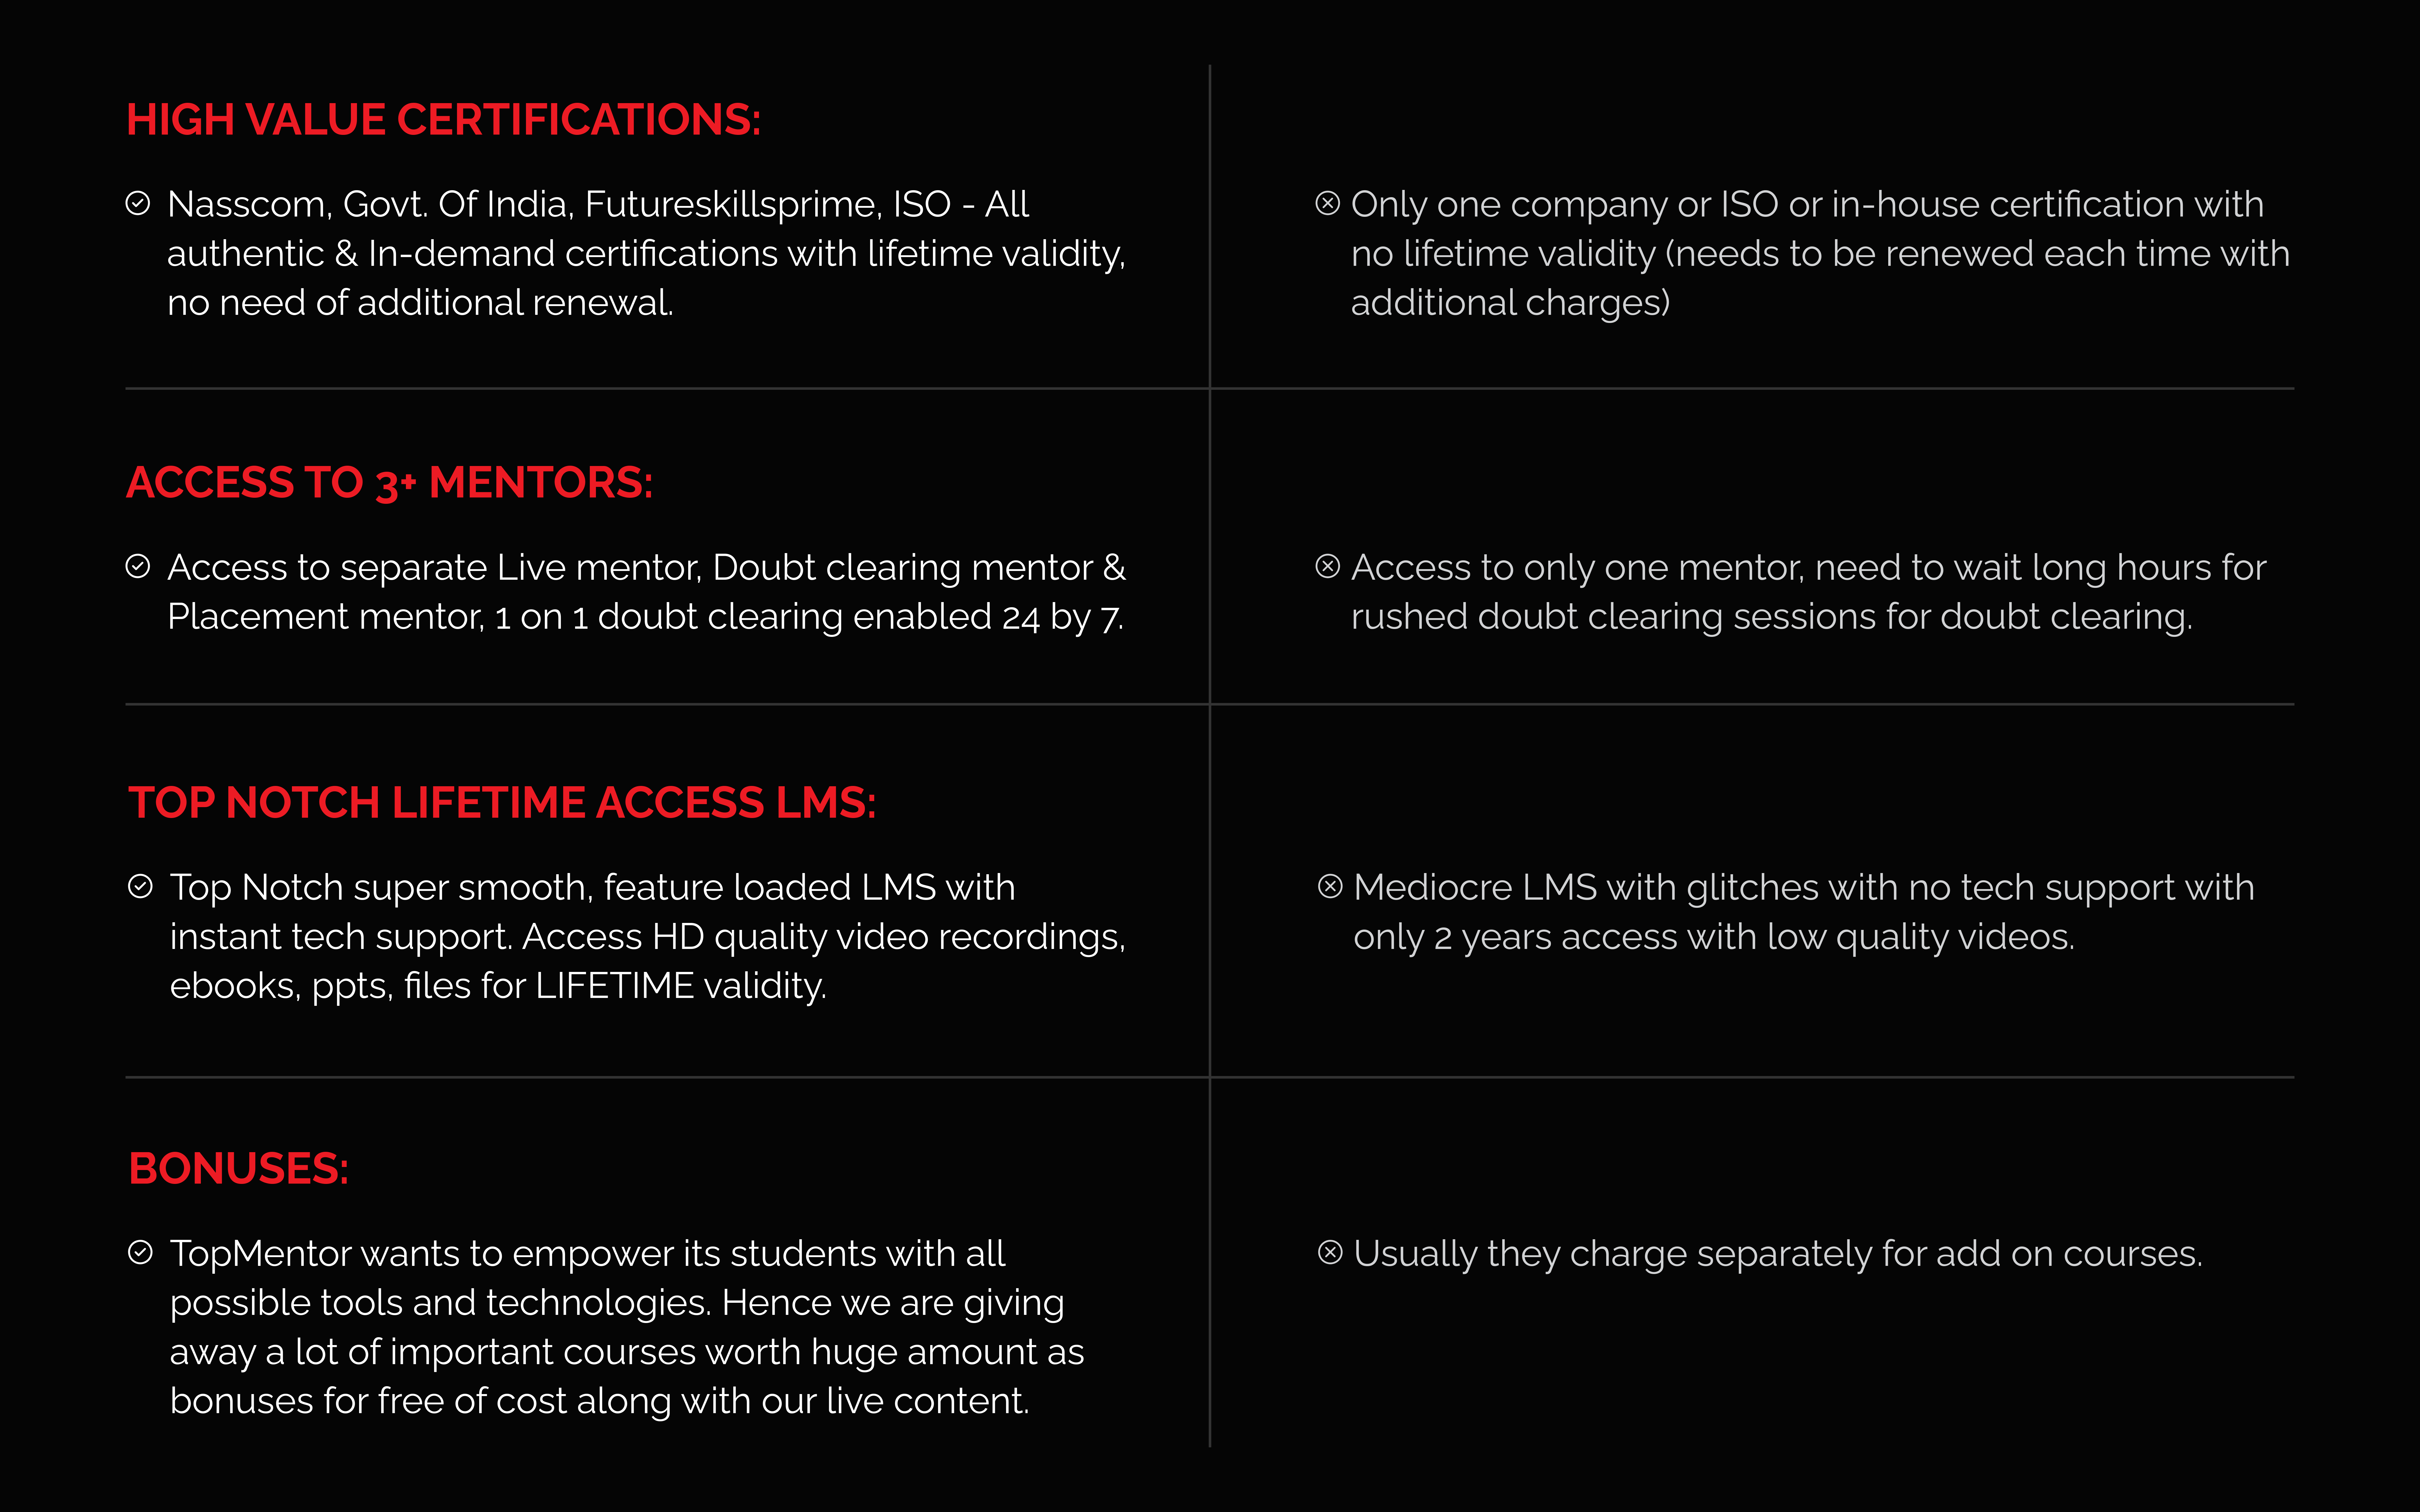

Lifetime LMS access ensures you can revisit course materials, updates, and resources anytime in the future—helping you refresh your skills whenever needed.


Self-paced learning allows you to study anytime, anywhere, at your own speed—making it easier to balance upskilling with work, college, or personal commitments.

Lifetime LMS access ensures you can revisit course materials, updates, and resources anytime in the future—helping you refresh your skills whenever needed.

Practical Project based learning can often lead to a deeper understanding of a concept through the act of personal experience.

One-to-one mentorship with mentor brings 2X faster doubt clearing. This setup allows you to build relationship with mentor, ask doubts on the go whenever you need to resolve them.

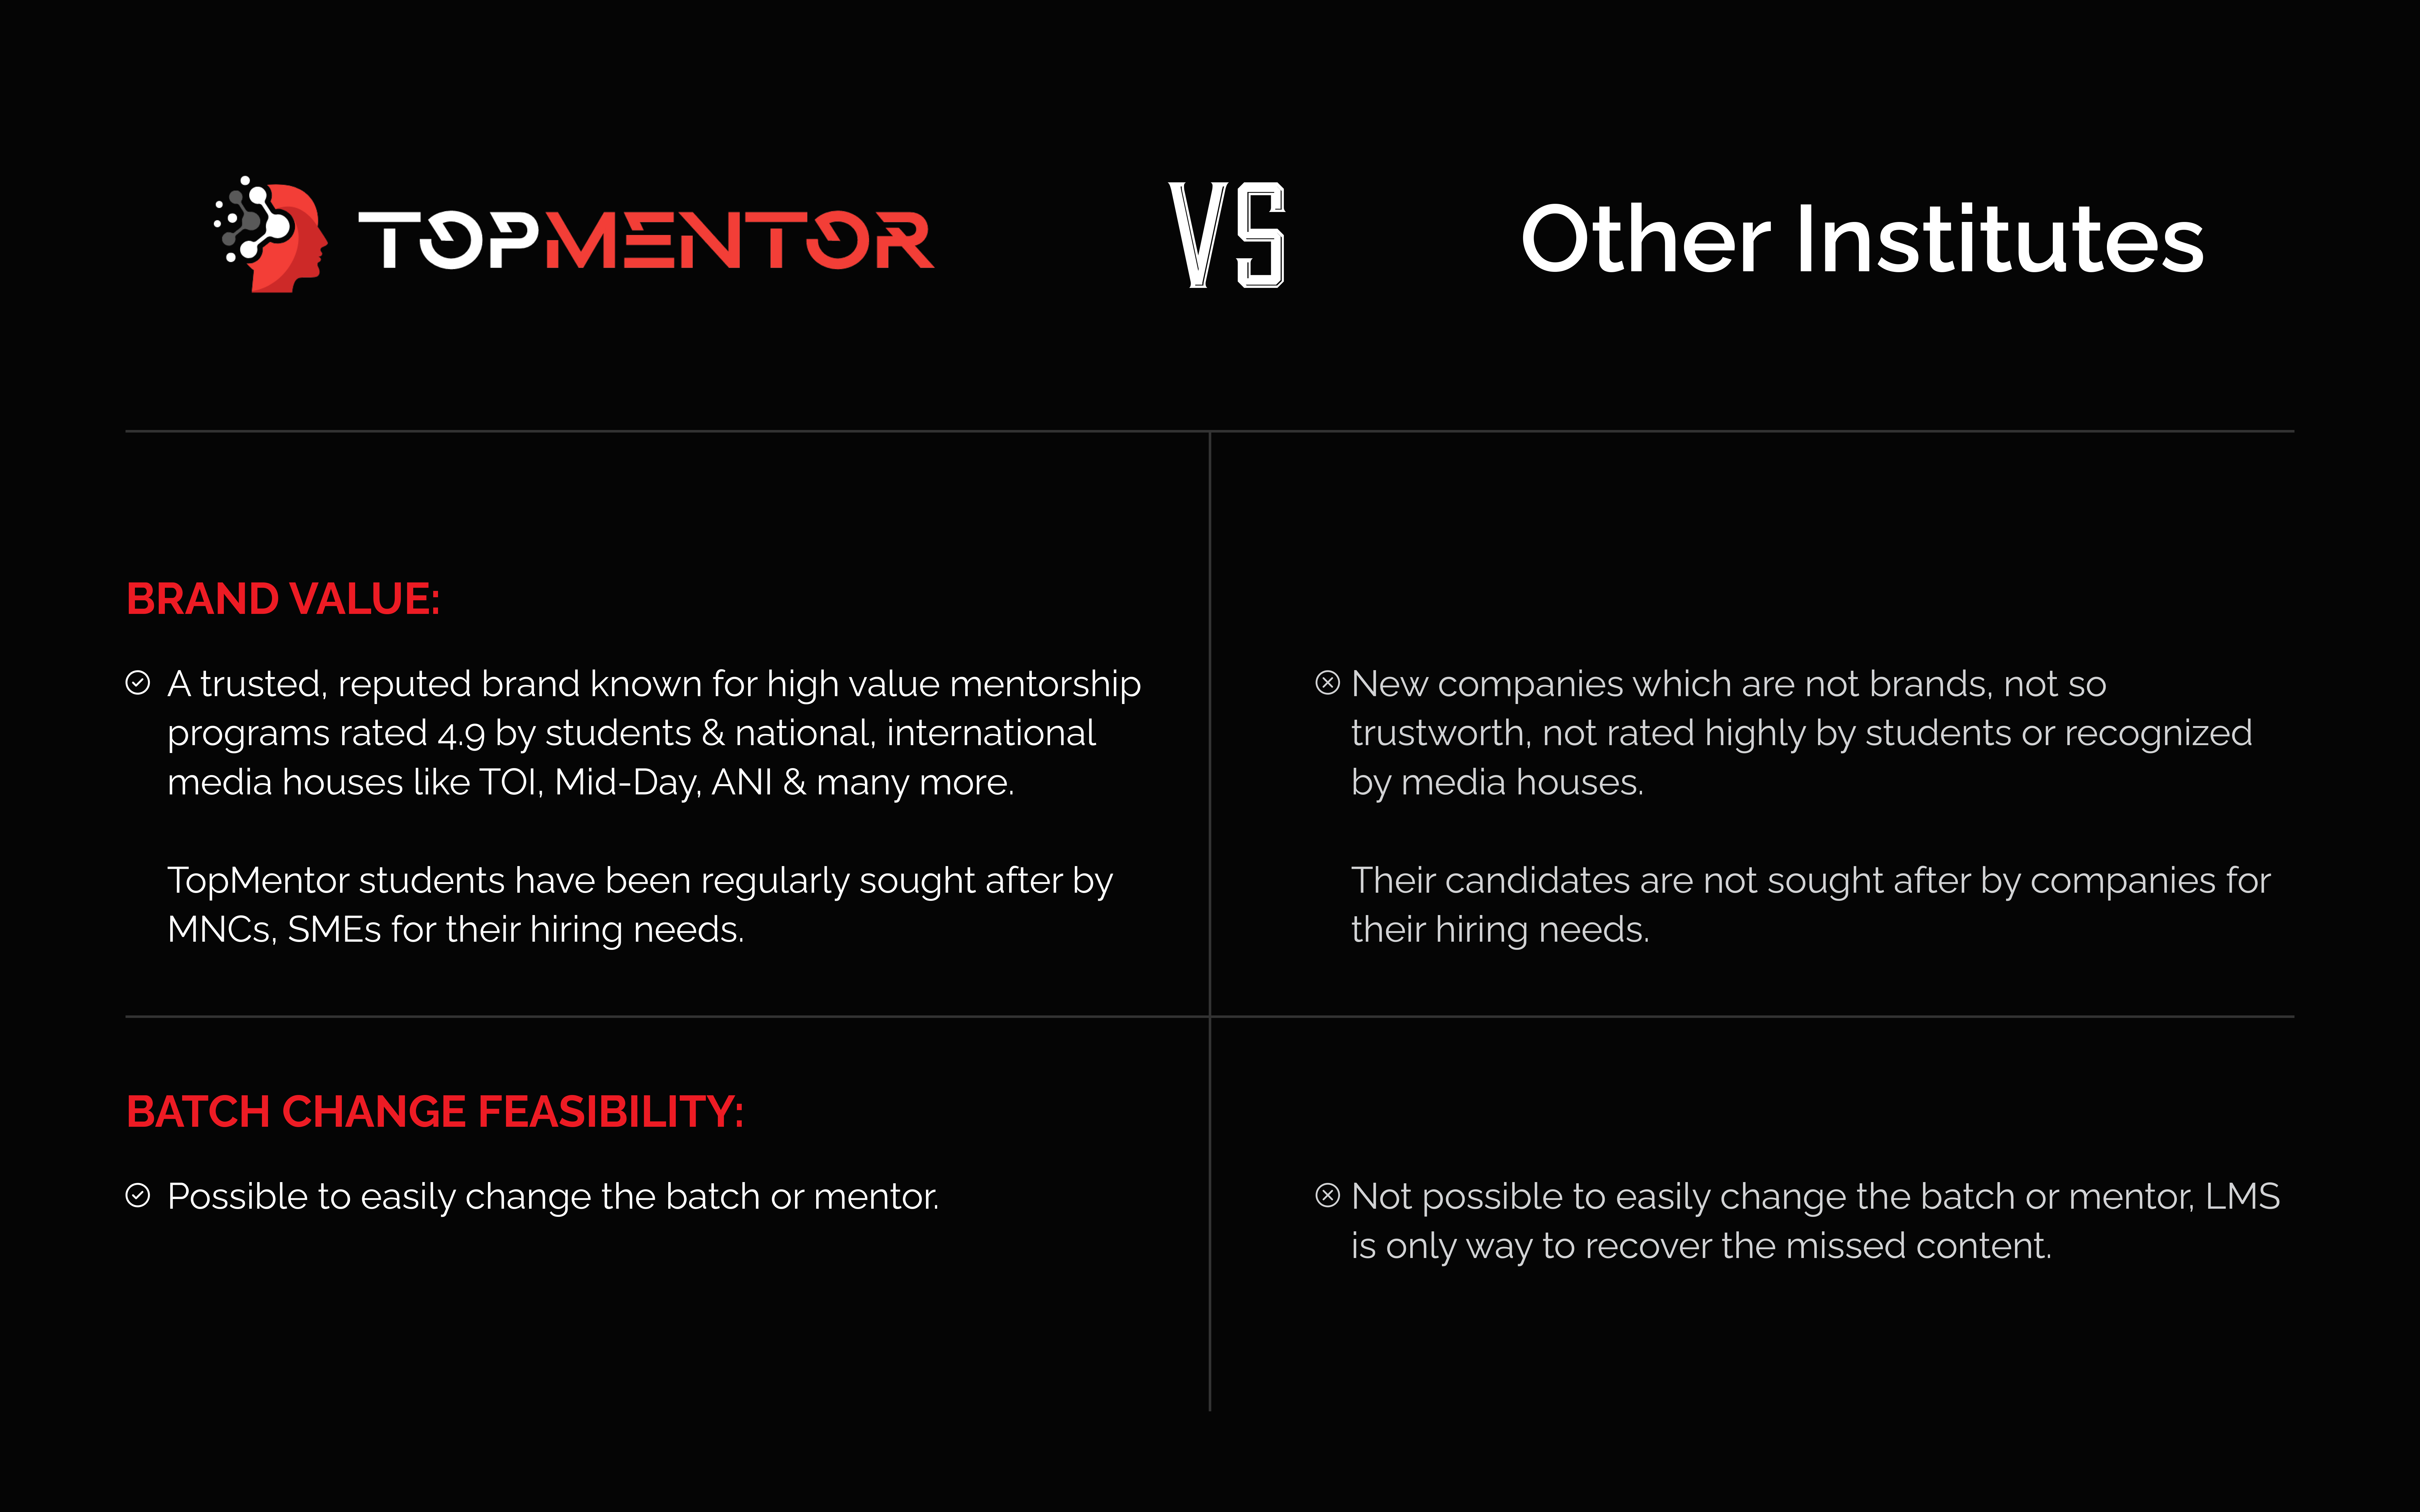
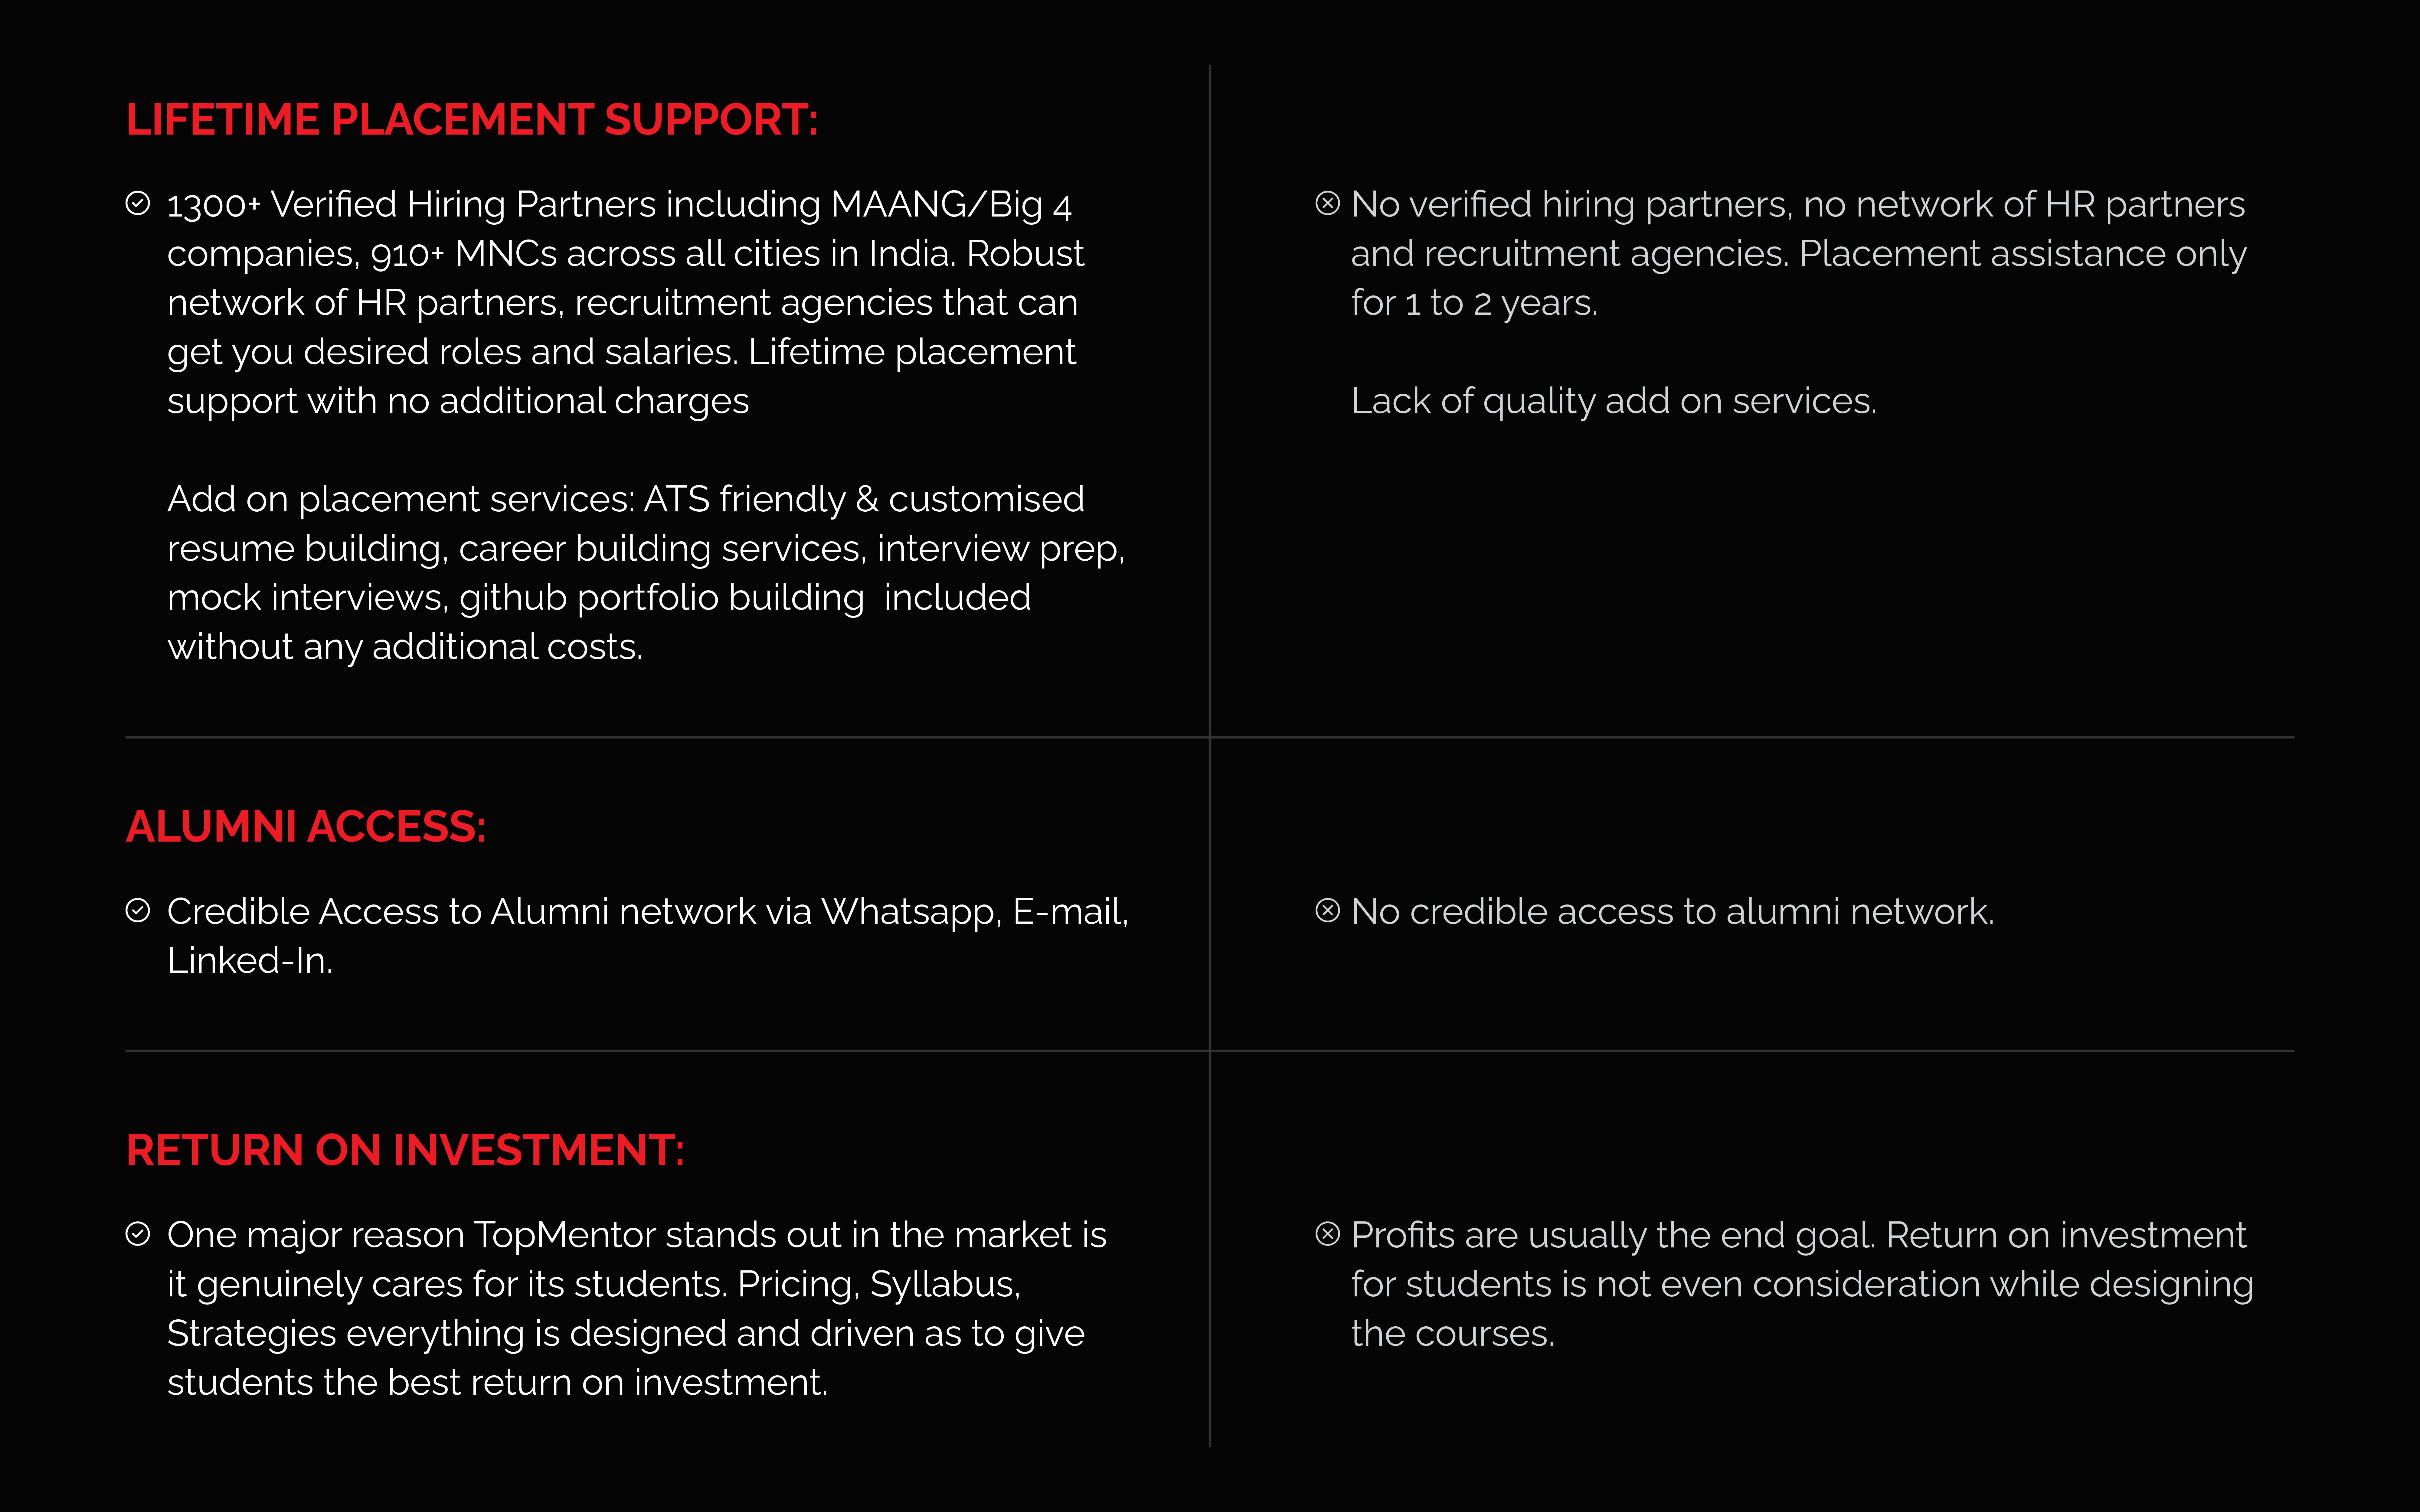
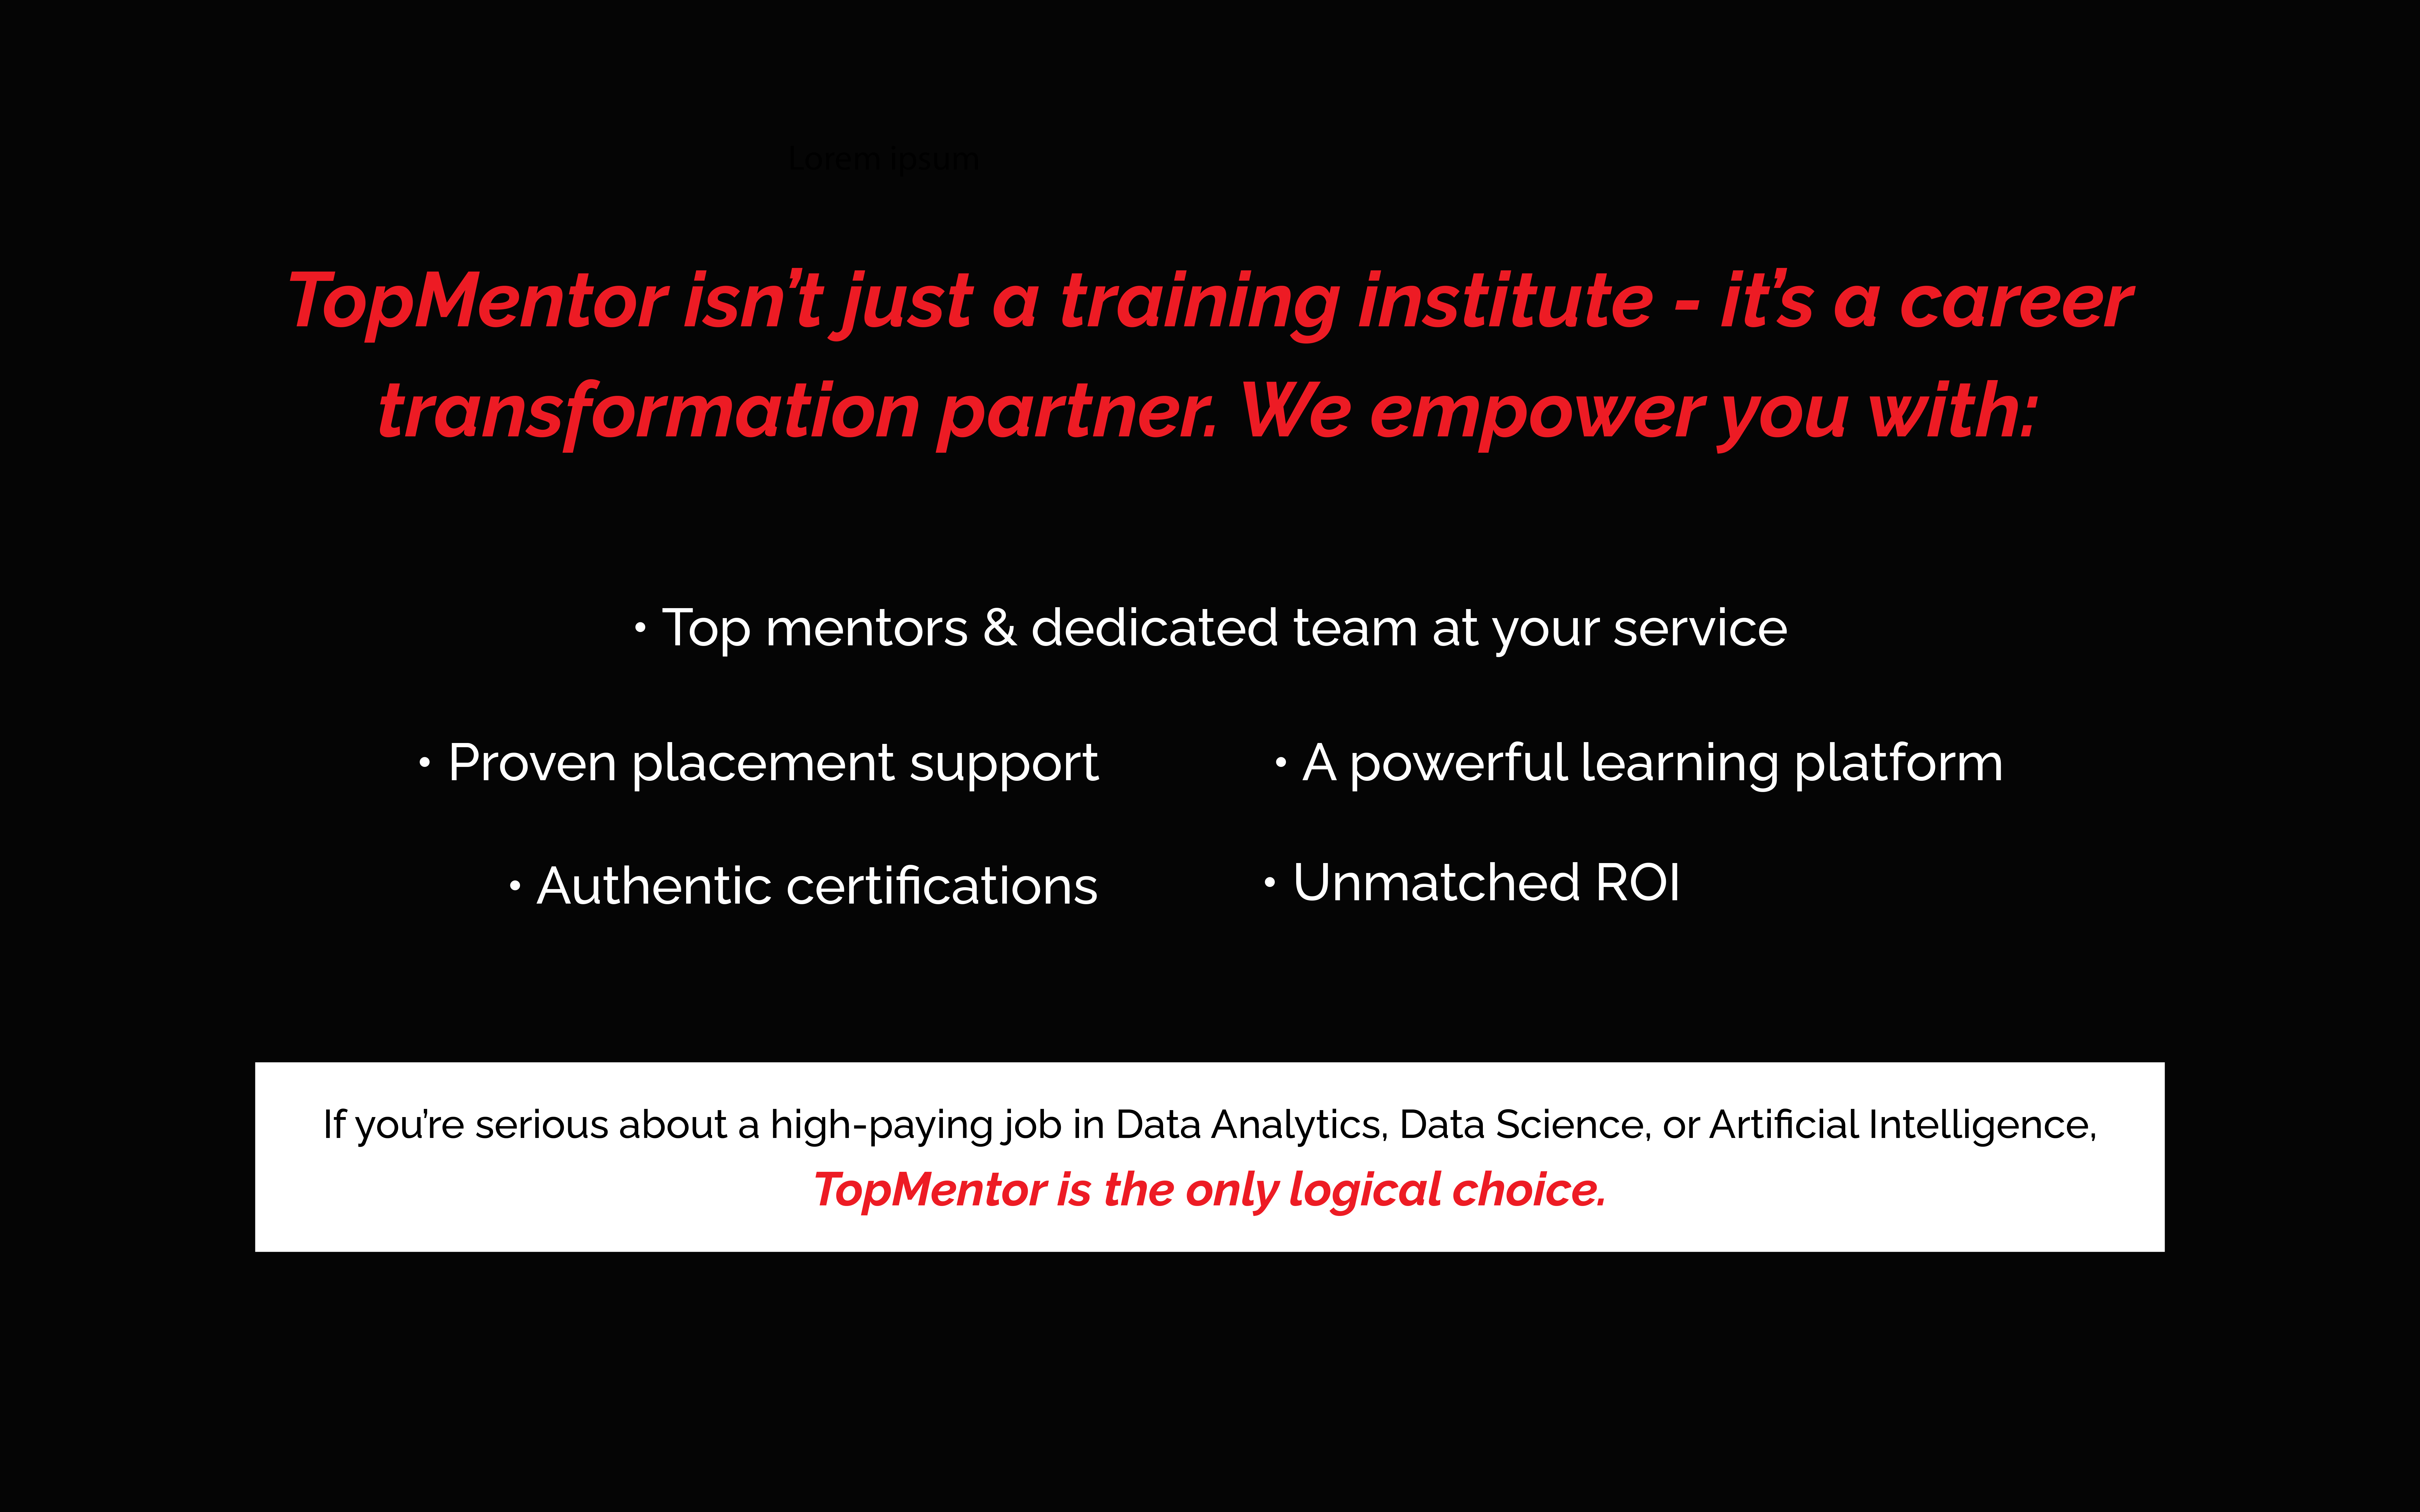
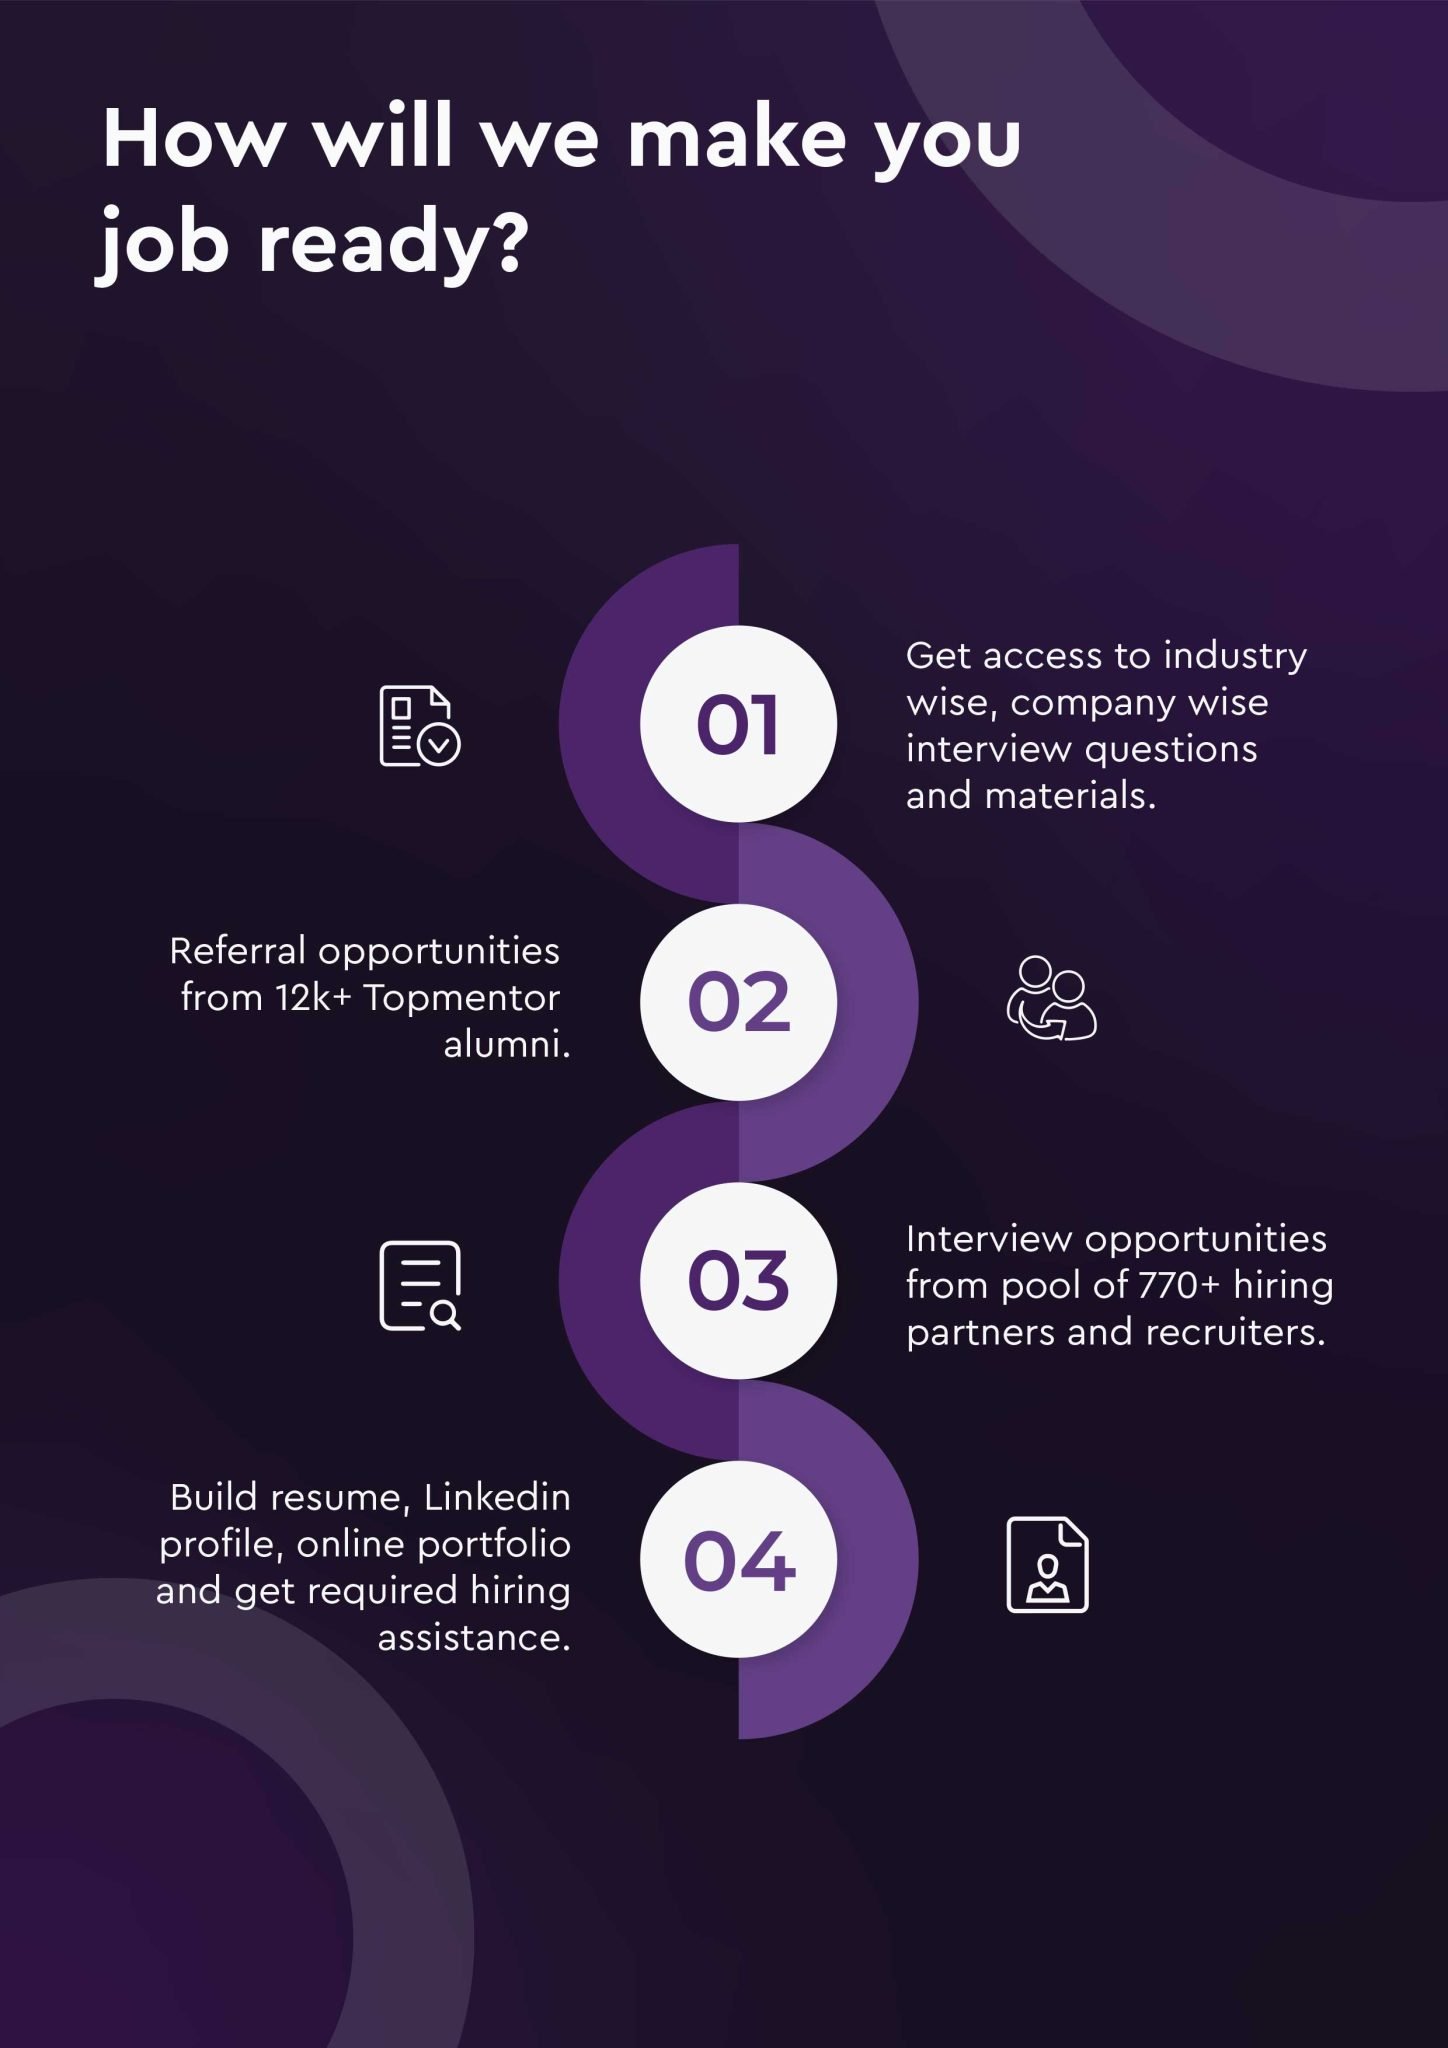
TopMentor takes care of entire 360 degree placement processes, offers 1200+ hiring partners, professional resume building, linkedin profile building, portfolio building, interview prep etc.

TopMentor co-founders had huge education loans when they started their careers. So when they founded the company, they were determined to keep the costs low and affordable to anyone willing to change his/her career.
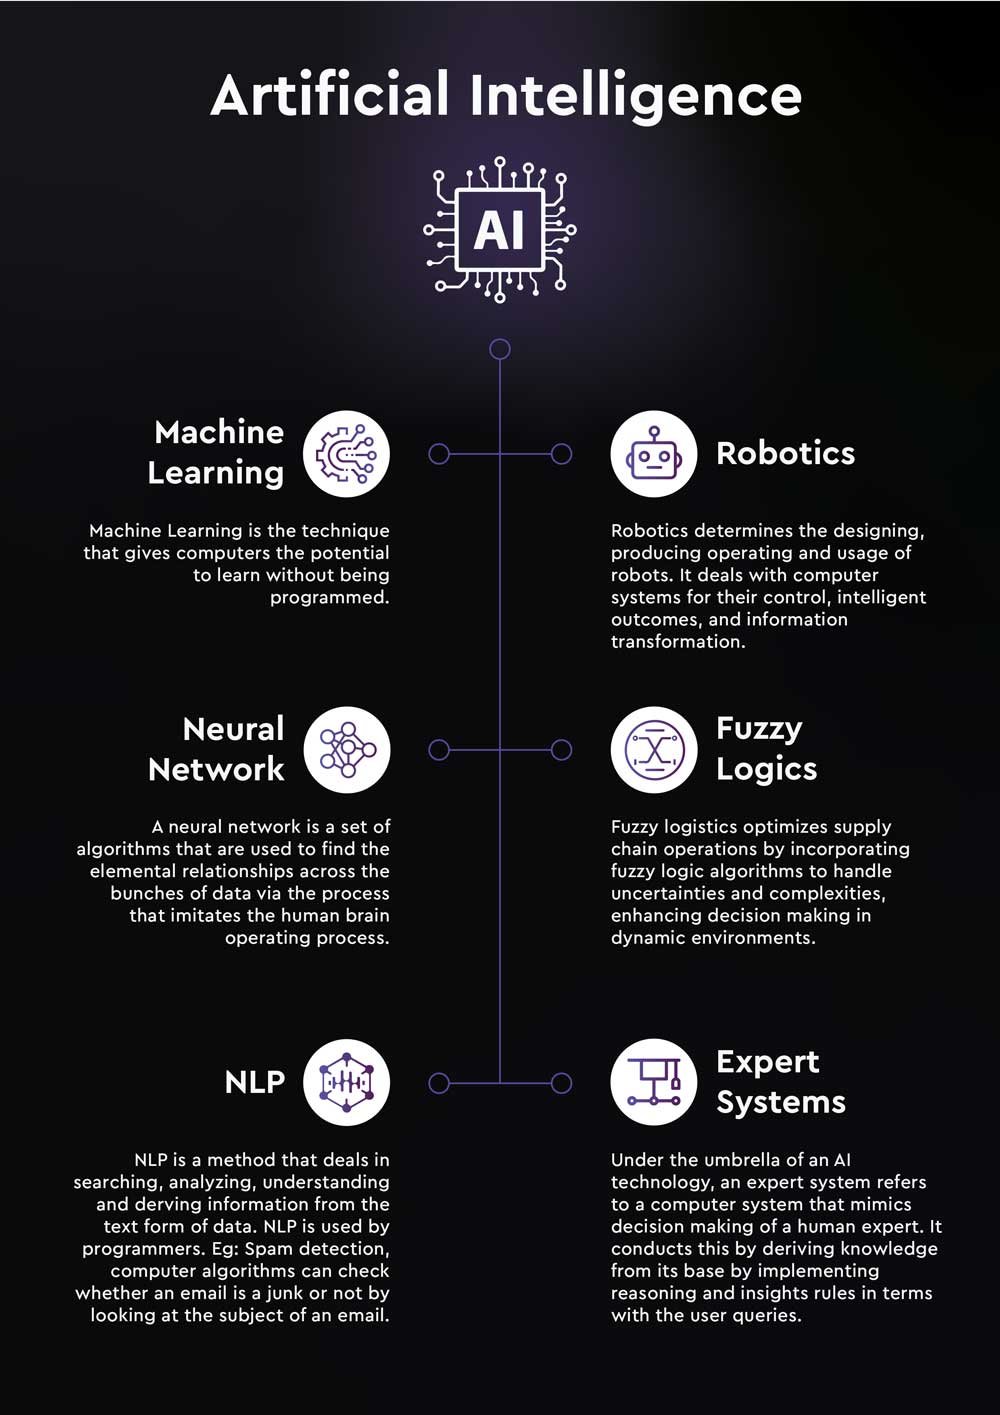

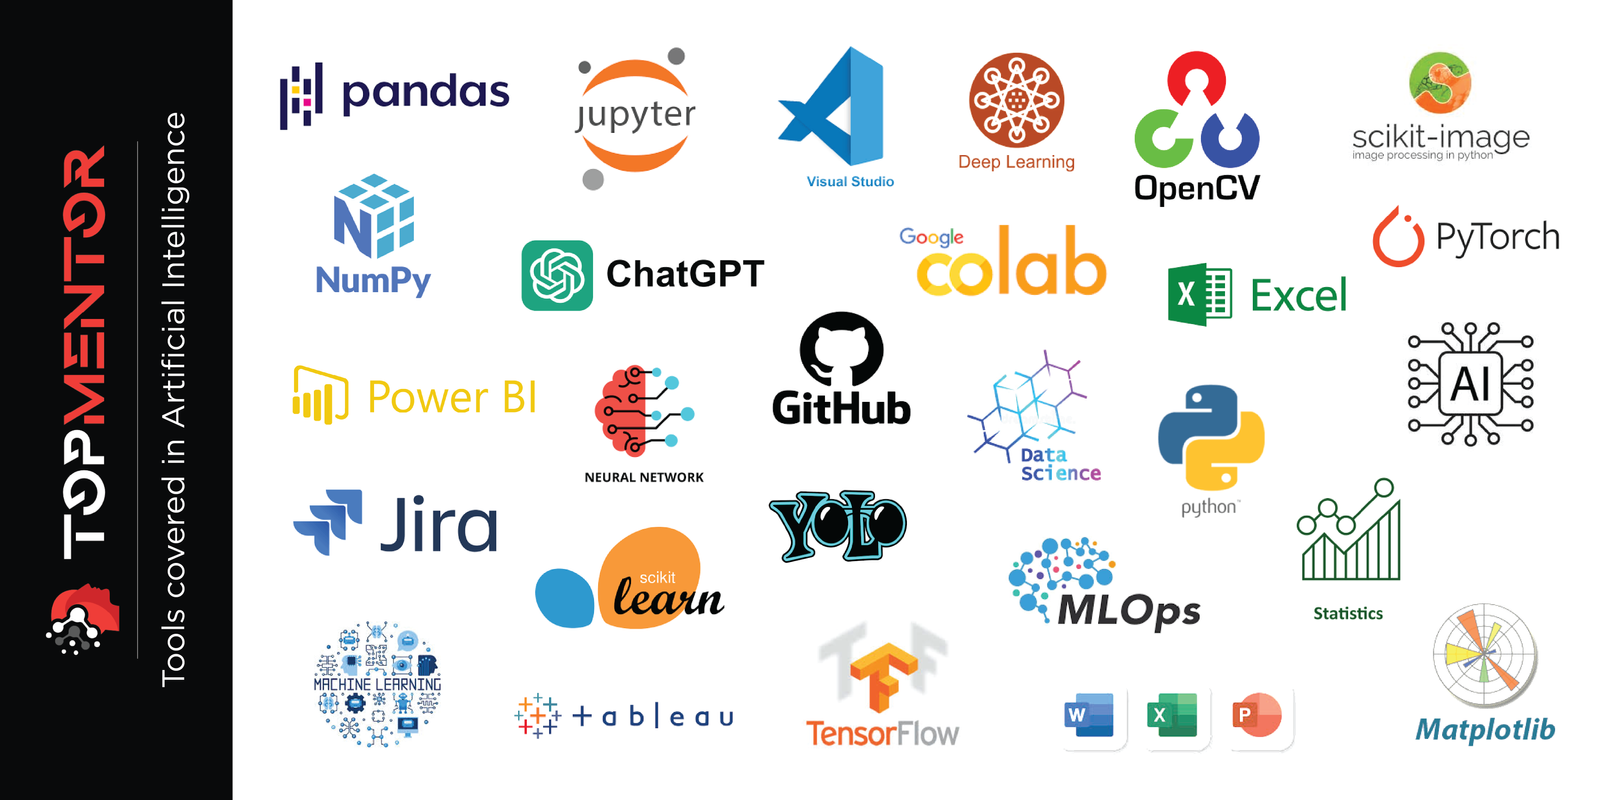
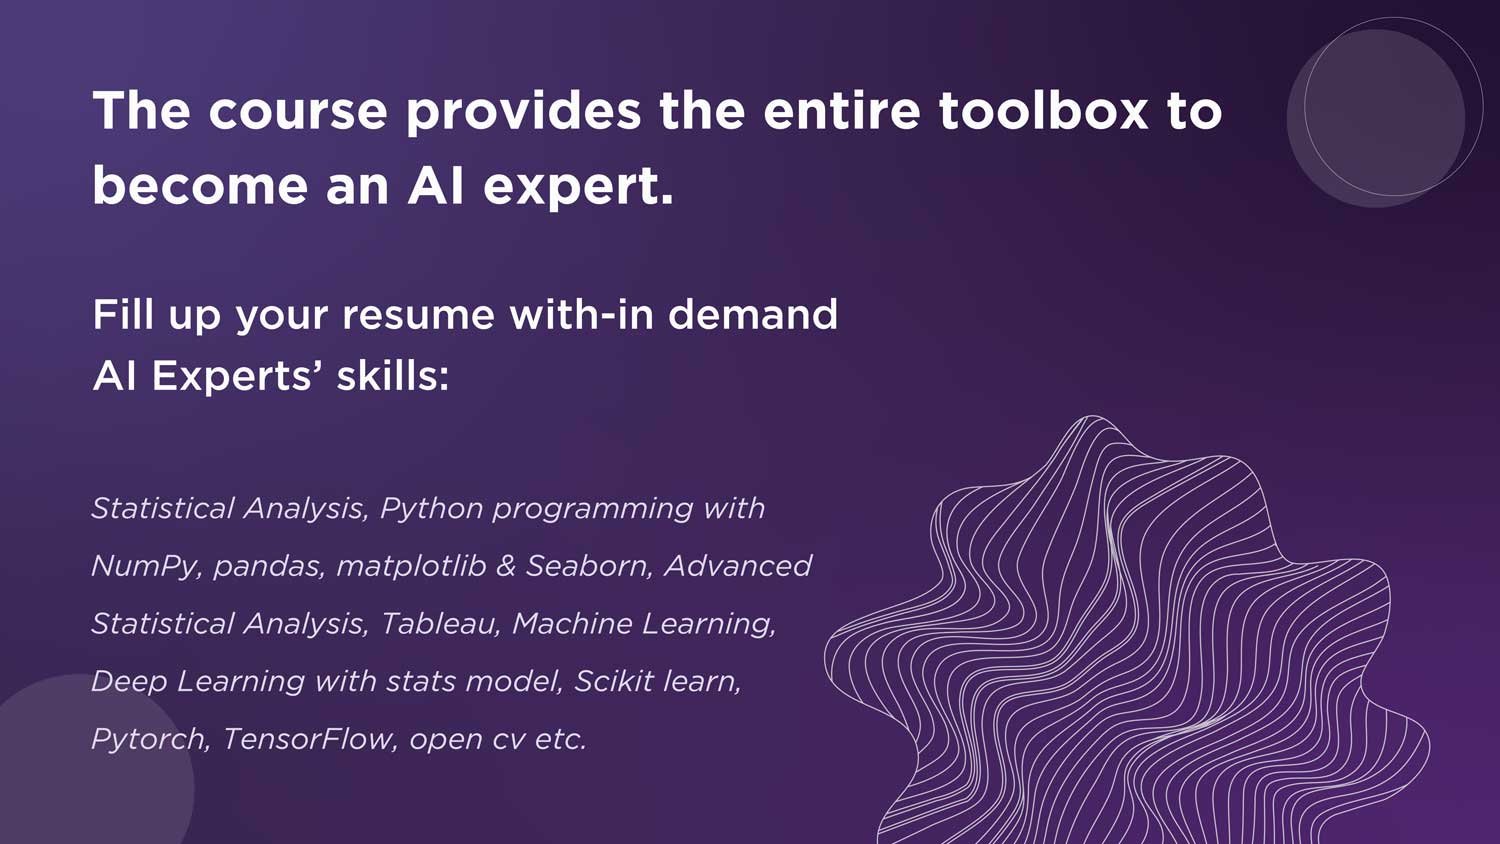
This part of AI training covers overview of artificial intelligence. In addition, terminologies & applications within AI along with 3 exercises

Don’t know python? No worries – we got your back. We will teach right from basics of python so even if you don’t know python, you would still be able to make it.

Our instructor is a master statistician & will help you easily understand and master statistics even though you are not good with maths.

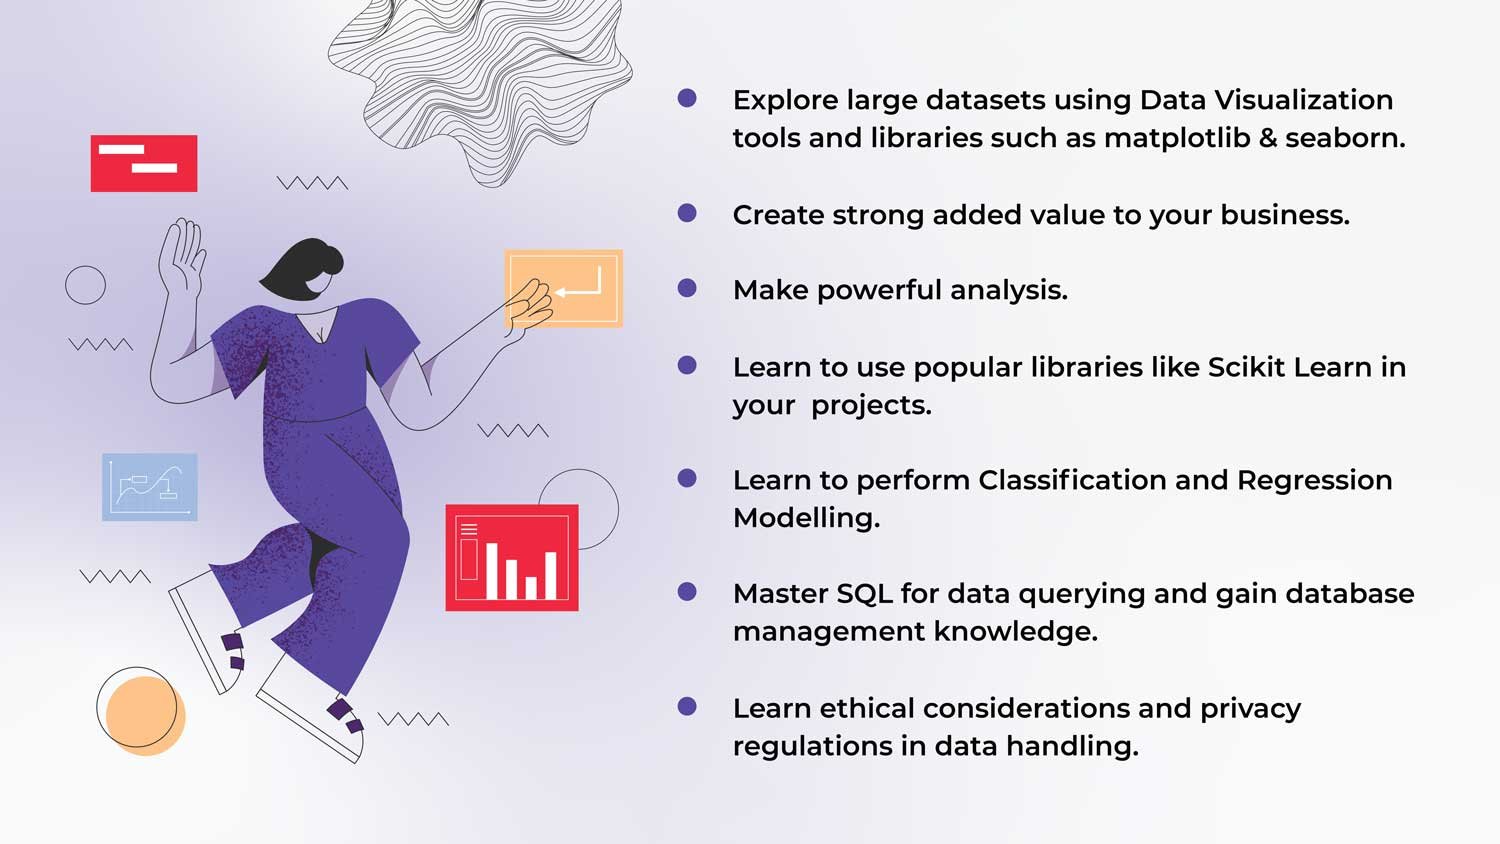
Training covers detailed practical process & execution. Master logical regressions, modeling. .Master Principles of Predictive analytics.

Learn to create machine learning algorithms in python. Master making robust machine learning models & using them to solve any complex problems.

Dive deep and practice real time on engaging visuals & capstone projects for your portfolio. Perfect for people without any prior oop knowledge.

Master various features of tableau. Create & design the visualizations for your audience. Learn to combine the data & practices to present your story

PowerBi is crucial for career because it equips learners with valuable data visualization skills which are highly sought after by companies

If you wanna begin your deep learning journey then this course is great for you. It is designed in easiest way such that you don’t get bogged down unnecessarily.

Best way to learn SQL is by practicing it. Install free open source database & start writing and running simple queries using data. MYSQL is a free popular database that is compatible with most operating systems.

Jira is most widely used bug tracking and project management tool. If you follow any development methodology you can easily start using Jira in your project as it provides best customization possibilities.
possibilities statistics can facilitate decision making and performance reviews for business. From statistics business can understand how customers behave and react to its offerings. Business can improve accordingly.
Github emphasizes iterative development and flexibility to adapt to changing requirements, while scrum provides a framework for managing complext projects

Github can easily be used as a collaboration platform among coders and can be used to build complex systems. As a beginner you should learn programing syntax first.