- LearnNEW
Self Paced Programs
Top Expert Trainers, Lowest Fees In The Industry & 100% Placement Assistance - Success Stories
- Workshops
- About
- Hire From Us
- Contact
- Careers
- Refer a Friend
Master's in Data Analytics With GenAI (Self-paced)
Learning data analytics empowers you to make informed, data-driven decisions that drive business success and career growth.
In collaboration with




In Collaboration with
Master's in Data Analytics With GenAI Program
- 13221+ students students ENROLLED with 4.95 ratinG
₹14,000 28,000
(Taxes Applicable, limited time offer)
- 250 hours of self paced content
- Learn from top 0.1% Data Analysts in india
- Upto 20 end-to-end projects
- Lifetime LMS access
- 14 globally accepted certificates
- Data science course free as a bonus
Top Highlights of Data Analytics With GenAi Program:

Learn at your pace & time
Self-paced learning allows you to study anytime, anywhere at your own speed - making it easier to balance upskilling with work, studies and other commitments.

Lifetime LMS Access
Lifetime LMS access ensures you can revisit the course materials, updates and resources anytime in future - helping you refresh your skills whenever needed.

100% Practical & Projects Driven Mentoring
Practical Project based learning can often lead to a deeper understanding of a concept through the act of personal experience.

1:1 Mentorship
One-to-one mentorship with mentor brings 2X faster doubt clearing. This setup allows you to build relationship with mentor, ask doubts on the go whenever you need to resolve them.

#1 in Placement Rates
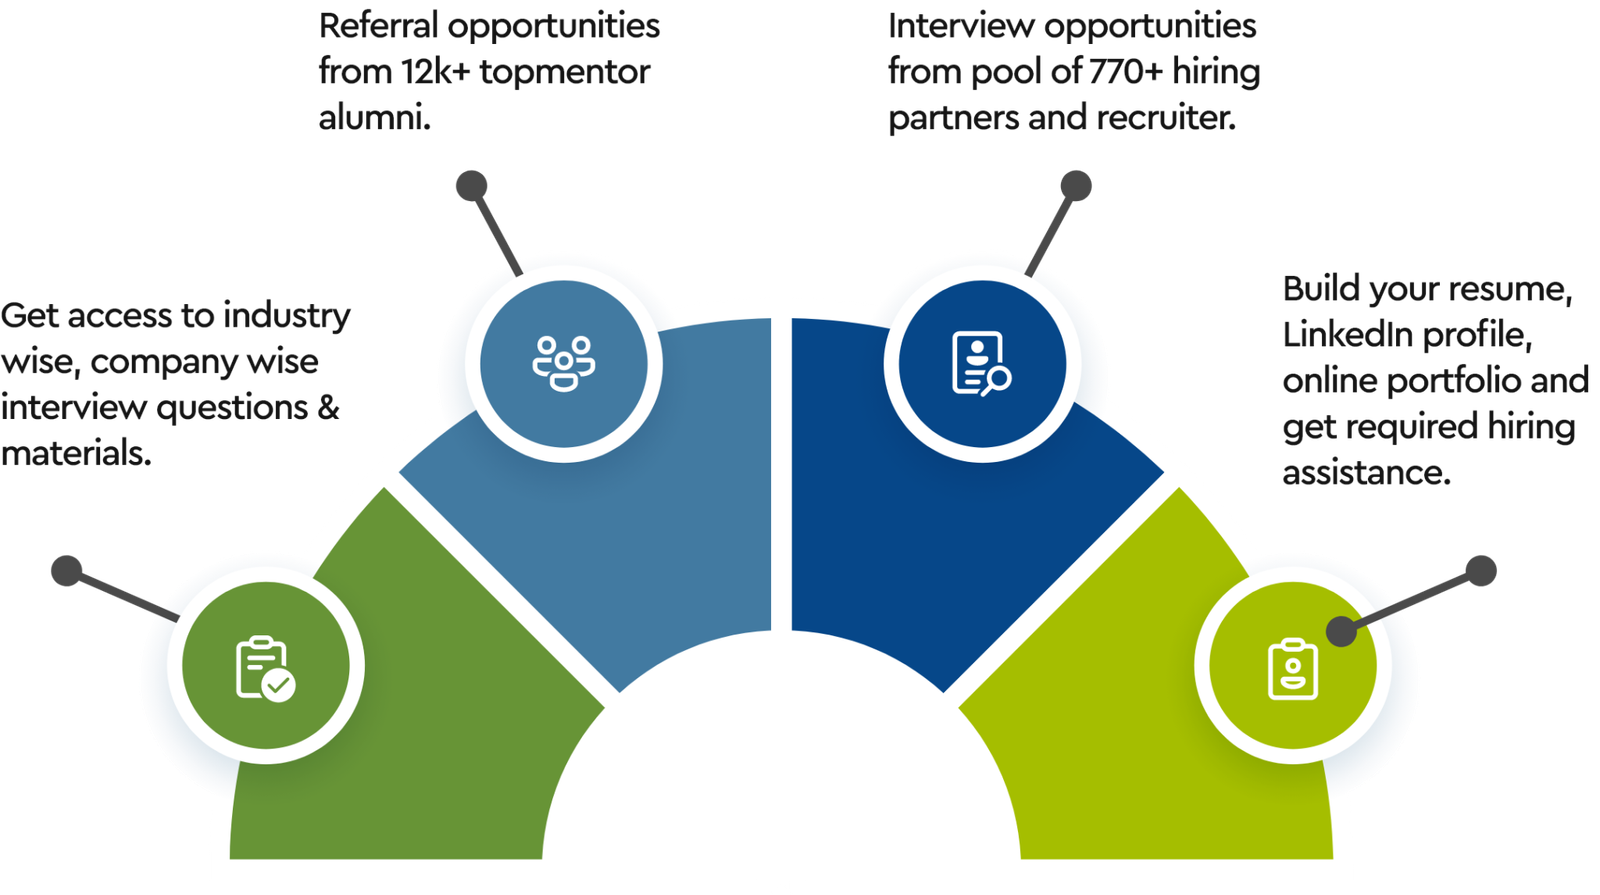
TopMentor takes care of entire 360 degree placement processes, offers 1200+ hiring partners, professional resume building, linkedin profile building, portfolio building, interview prep etc.

Lowest Fees, 10X ROI
TopMentor co-founders had huge education loans when they started their careers. So when they founded the company, they were determined to keep the costs low and affordable to anyone willing to change his/her career.
From learning to earning - TopMentor has you covered!
At TopMentor, we see training as just the first step — your long-term success is what truly matters to us. Our placement support goes beyond the classroom, offering lifetime career guidance that includes ATS-optimized resume building, role-specific mock interviews, and personalized coaching from seasoned industry experts. Through our network of hiring partners, you’ll receive guaranteed interview calls and access to exclusive job opportunities tailored to your skills. With TopMentor, you’re never alone in your career journey — we stand with you until you land your dream role, and continue supporting you well into your professional growth.
Award winning
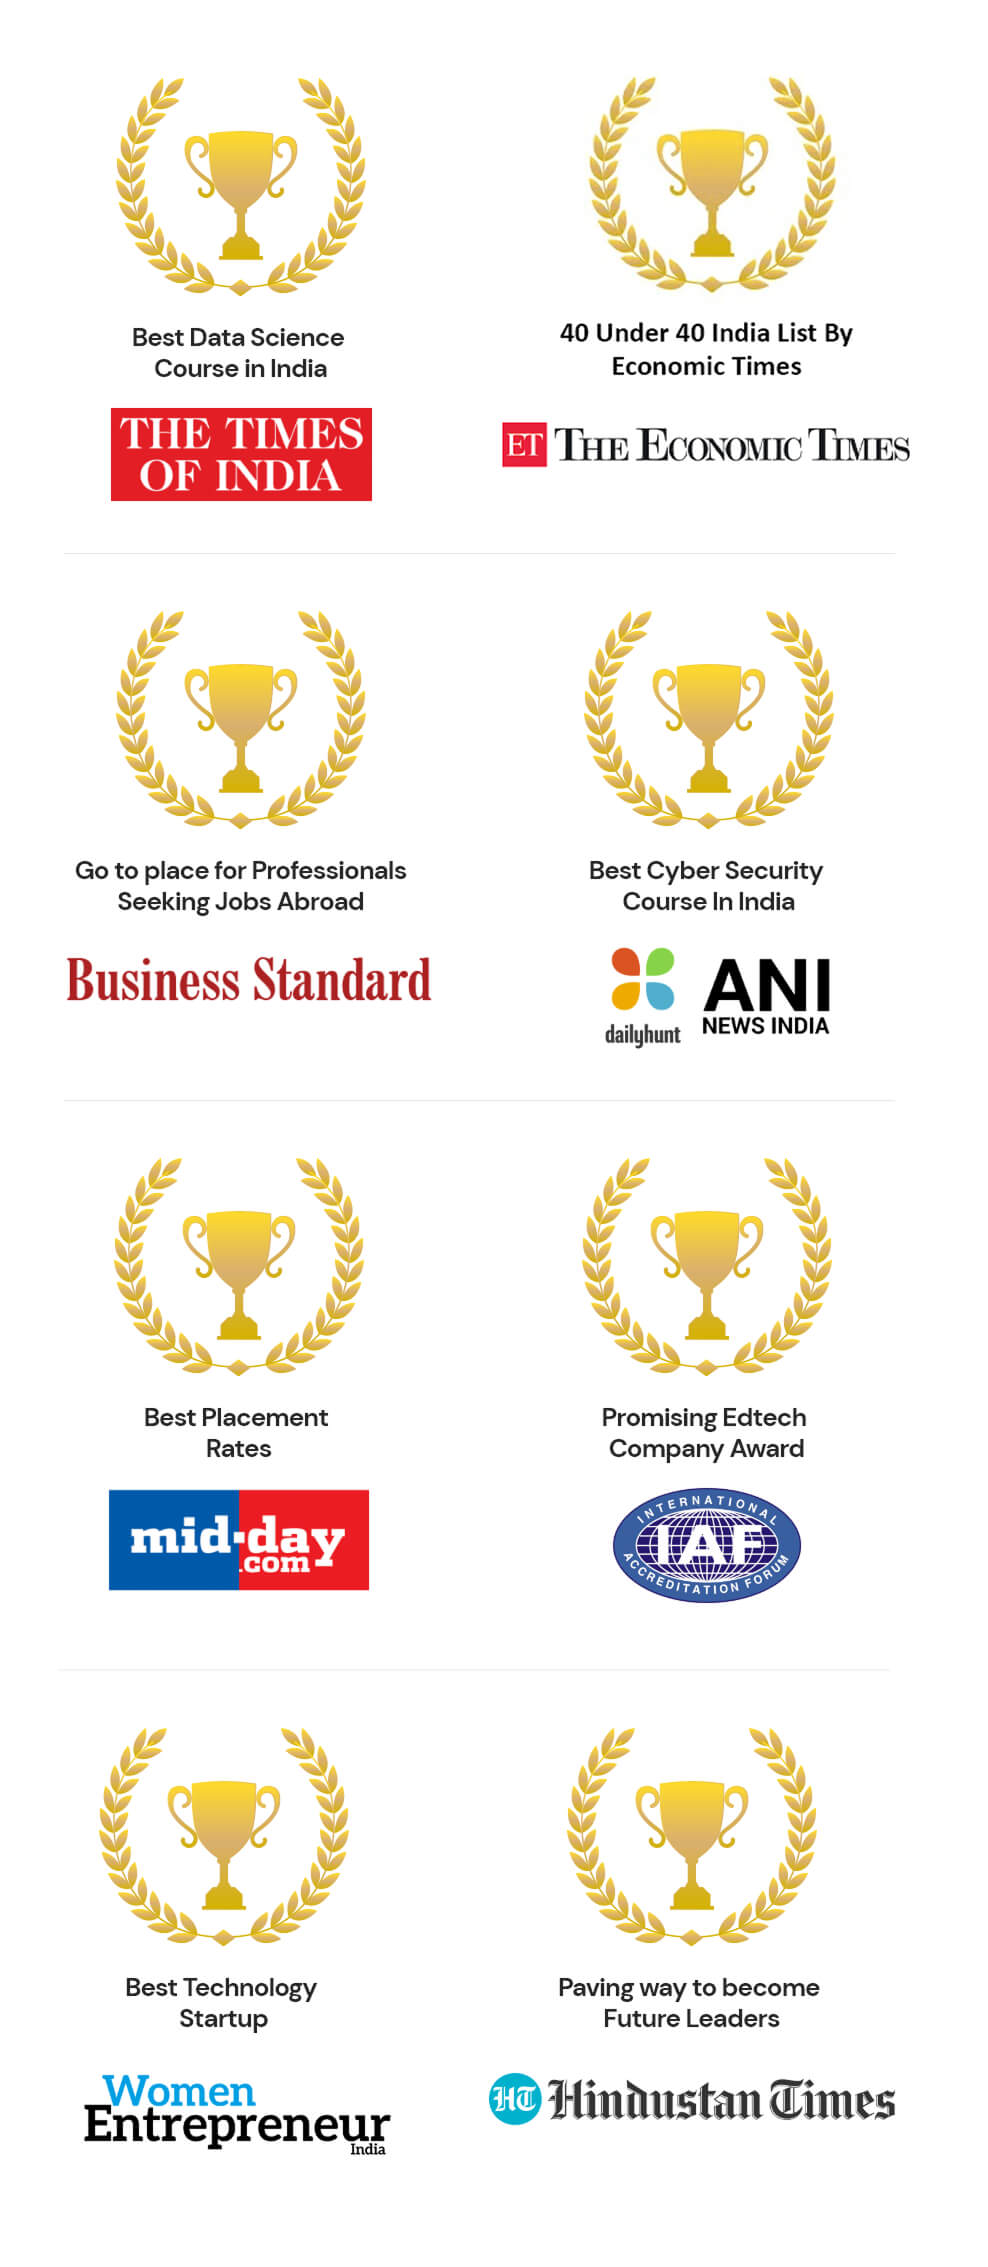
'Top Mentor' offers the best data analytics course with highest placement rates resulting in multiple awards.
Technology Driven
At TopMentor We blend cutting-edge tech with real world mentorship to future-proof your career.
Experts & Mentors
At TopMentor, most of the mentors come from IITs, MITs of the world & have huge experience in the field.
Career Strategy
Mentors Will Personally Guide You, Help You Find Jobs Ensuring Your Success In Data Analytics Career.
Deepest Syllabus
Syllabus is designed by top Data Analysts keeping best interest of students. It focuses on delivering results and jobs to students.
Future Opportunities
We Have Tie-ups WIth HRs & Placement Agencies. So You Will Get 100% Job Assistance After The End Of this Data Analytics Course in India.
Register Today to unlock Bonuses worth ₹ 200,000+ !
Why everyone should learn Data Analytics?
Data analytics involves deriving actionable insights from data to enhance business productivity, efficiency, and revenue.
Problem-Solving Skills
Analytics involves solving complex problems making it a valuable skill both professionally and in everyday life. The ability to analyze data and draw conclusions is highly sought after.
High Demand
Data analysts are in high demand, with a looming skill shortage predicted as more industries embrace big data. This trend translates into higher salaries and numerous job opportunities for graduates with analytics skills.
Wide Range of Opportunities
The data analytics boom has created diverse job opportunities across various industries, including aviation, government, and more. This field offers exciting career prospects and the potential for global opportunities.
Growing Importance
The world of analytics is currently experiencing a significant boom, driven by the abundance of available data. As data becomes more valuable, the demand for data analysts will increase, offering better job prospects and career advancement.
Range of Skills
Data analytics encompasses more than just data manipulation and problem-solving. It also involves effective communication of complex information and often leads to the development of leadership skills, making it a well-rounded career choice.
19x
Data-driven organizations have a 19x higher likelihood of being profitable.
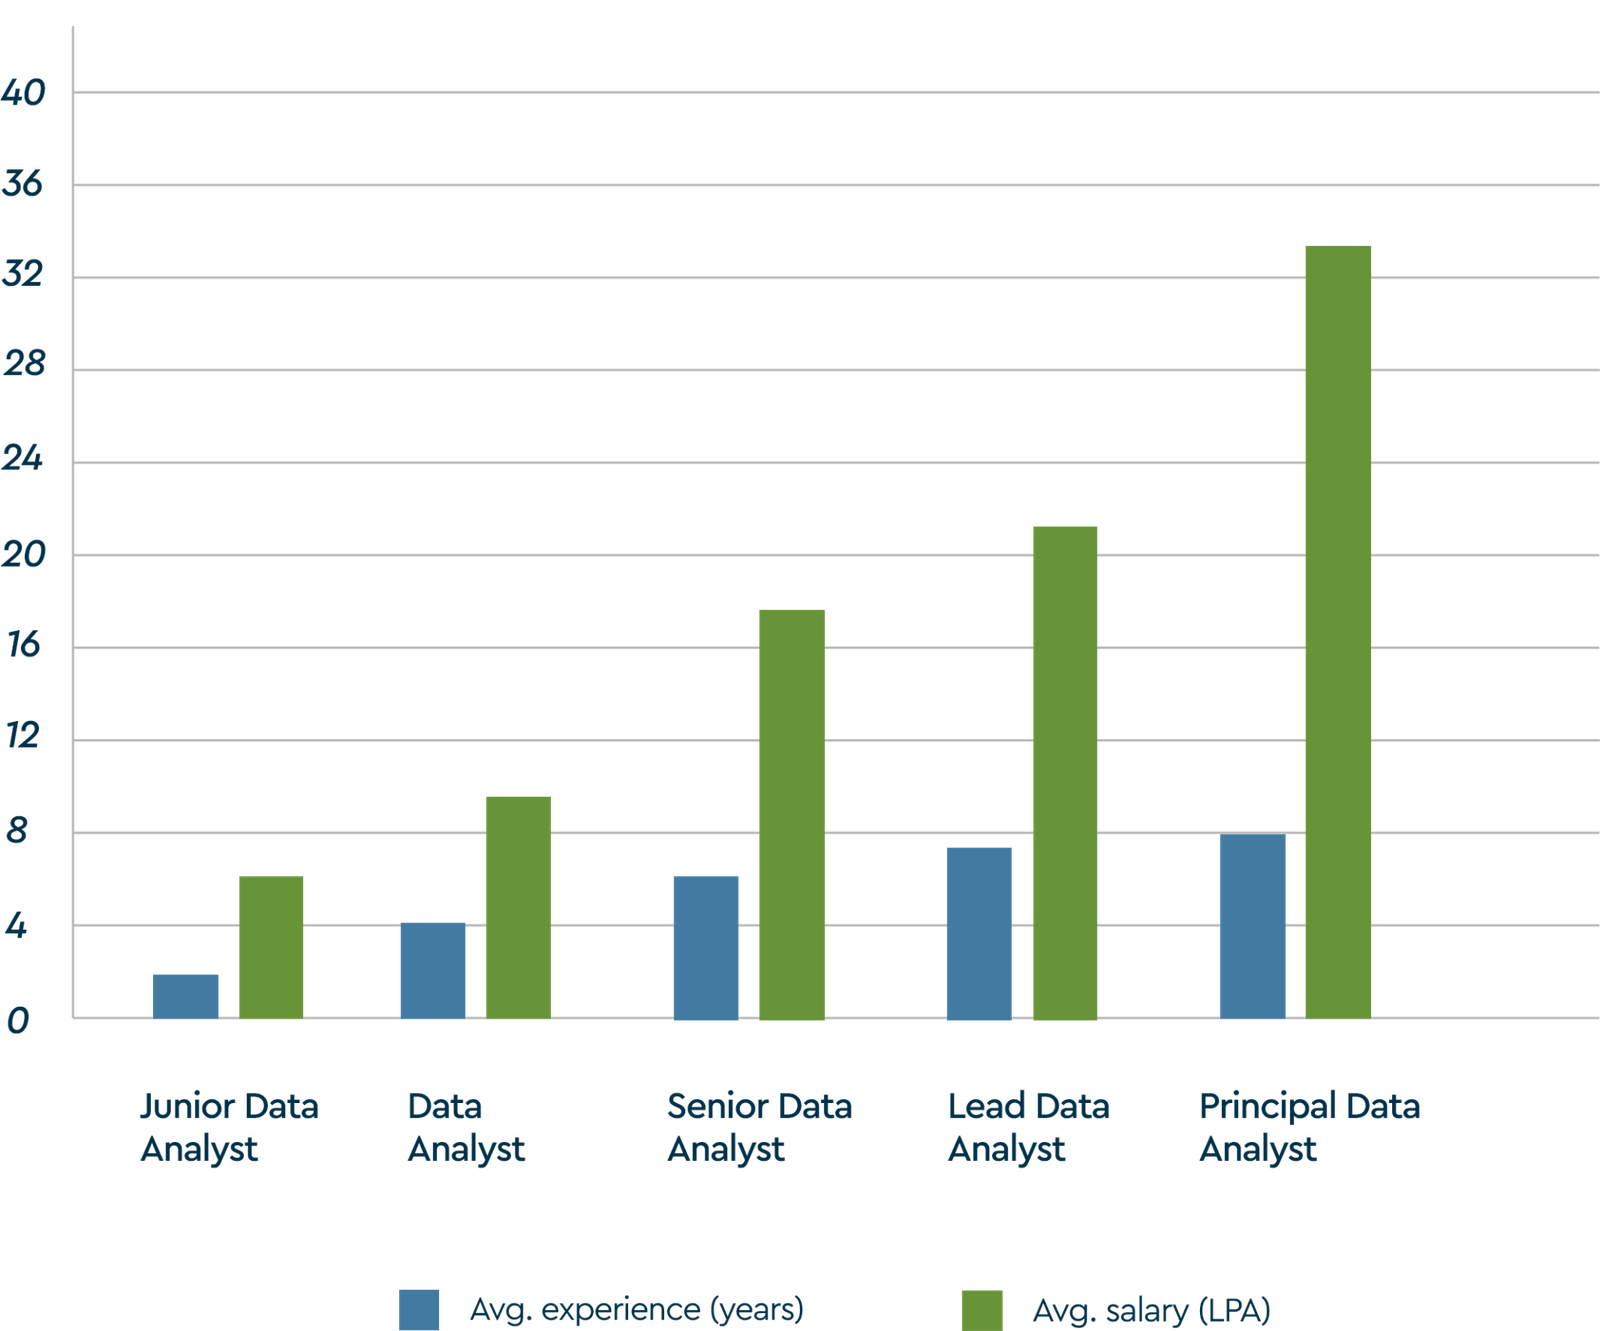
Career Trajectory and Salary Trends
**Source: Glassdoor, Ambitionbox
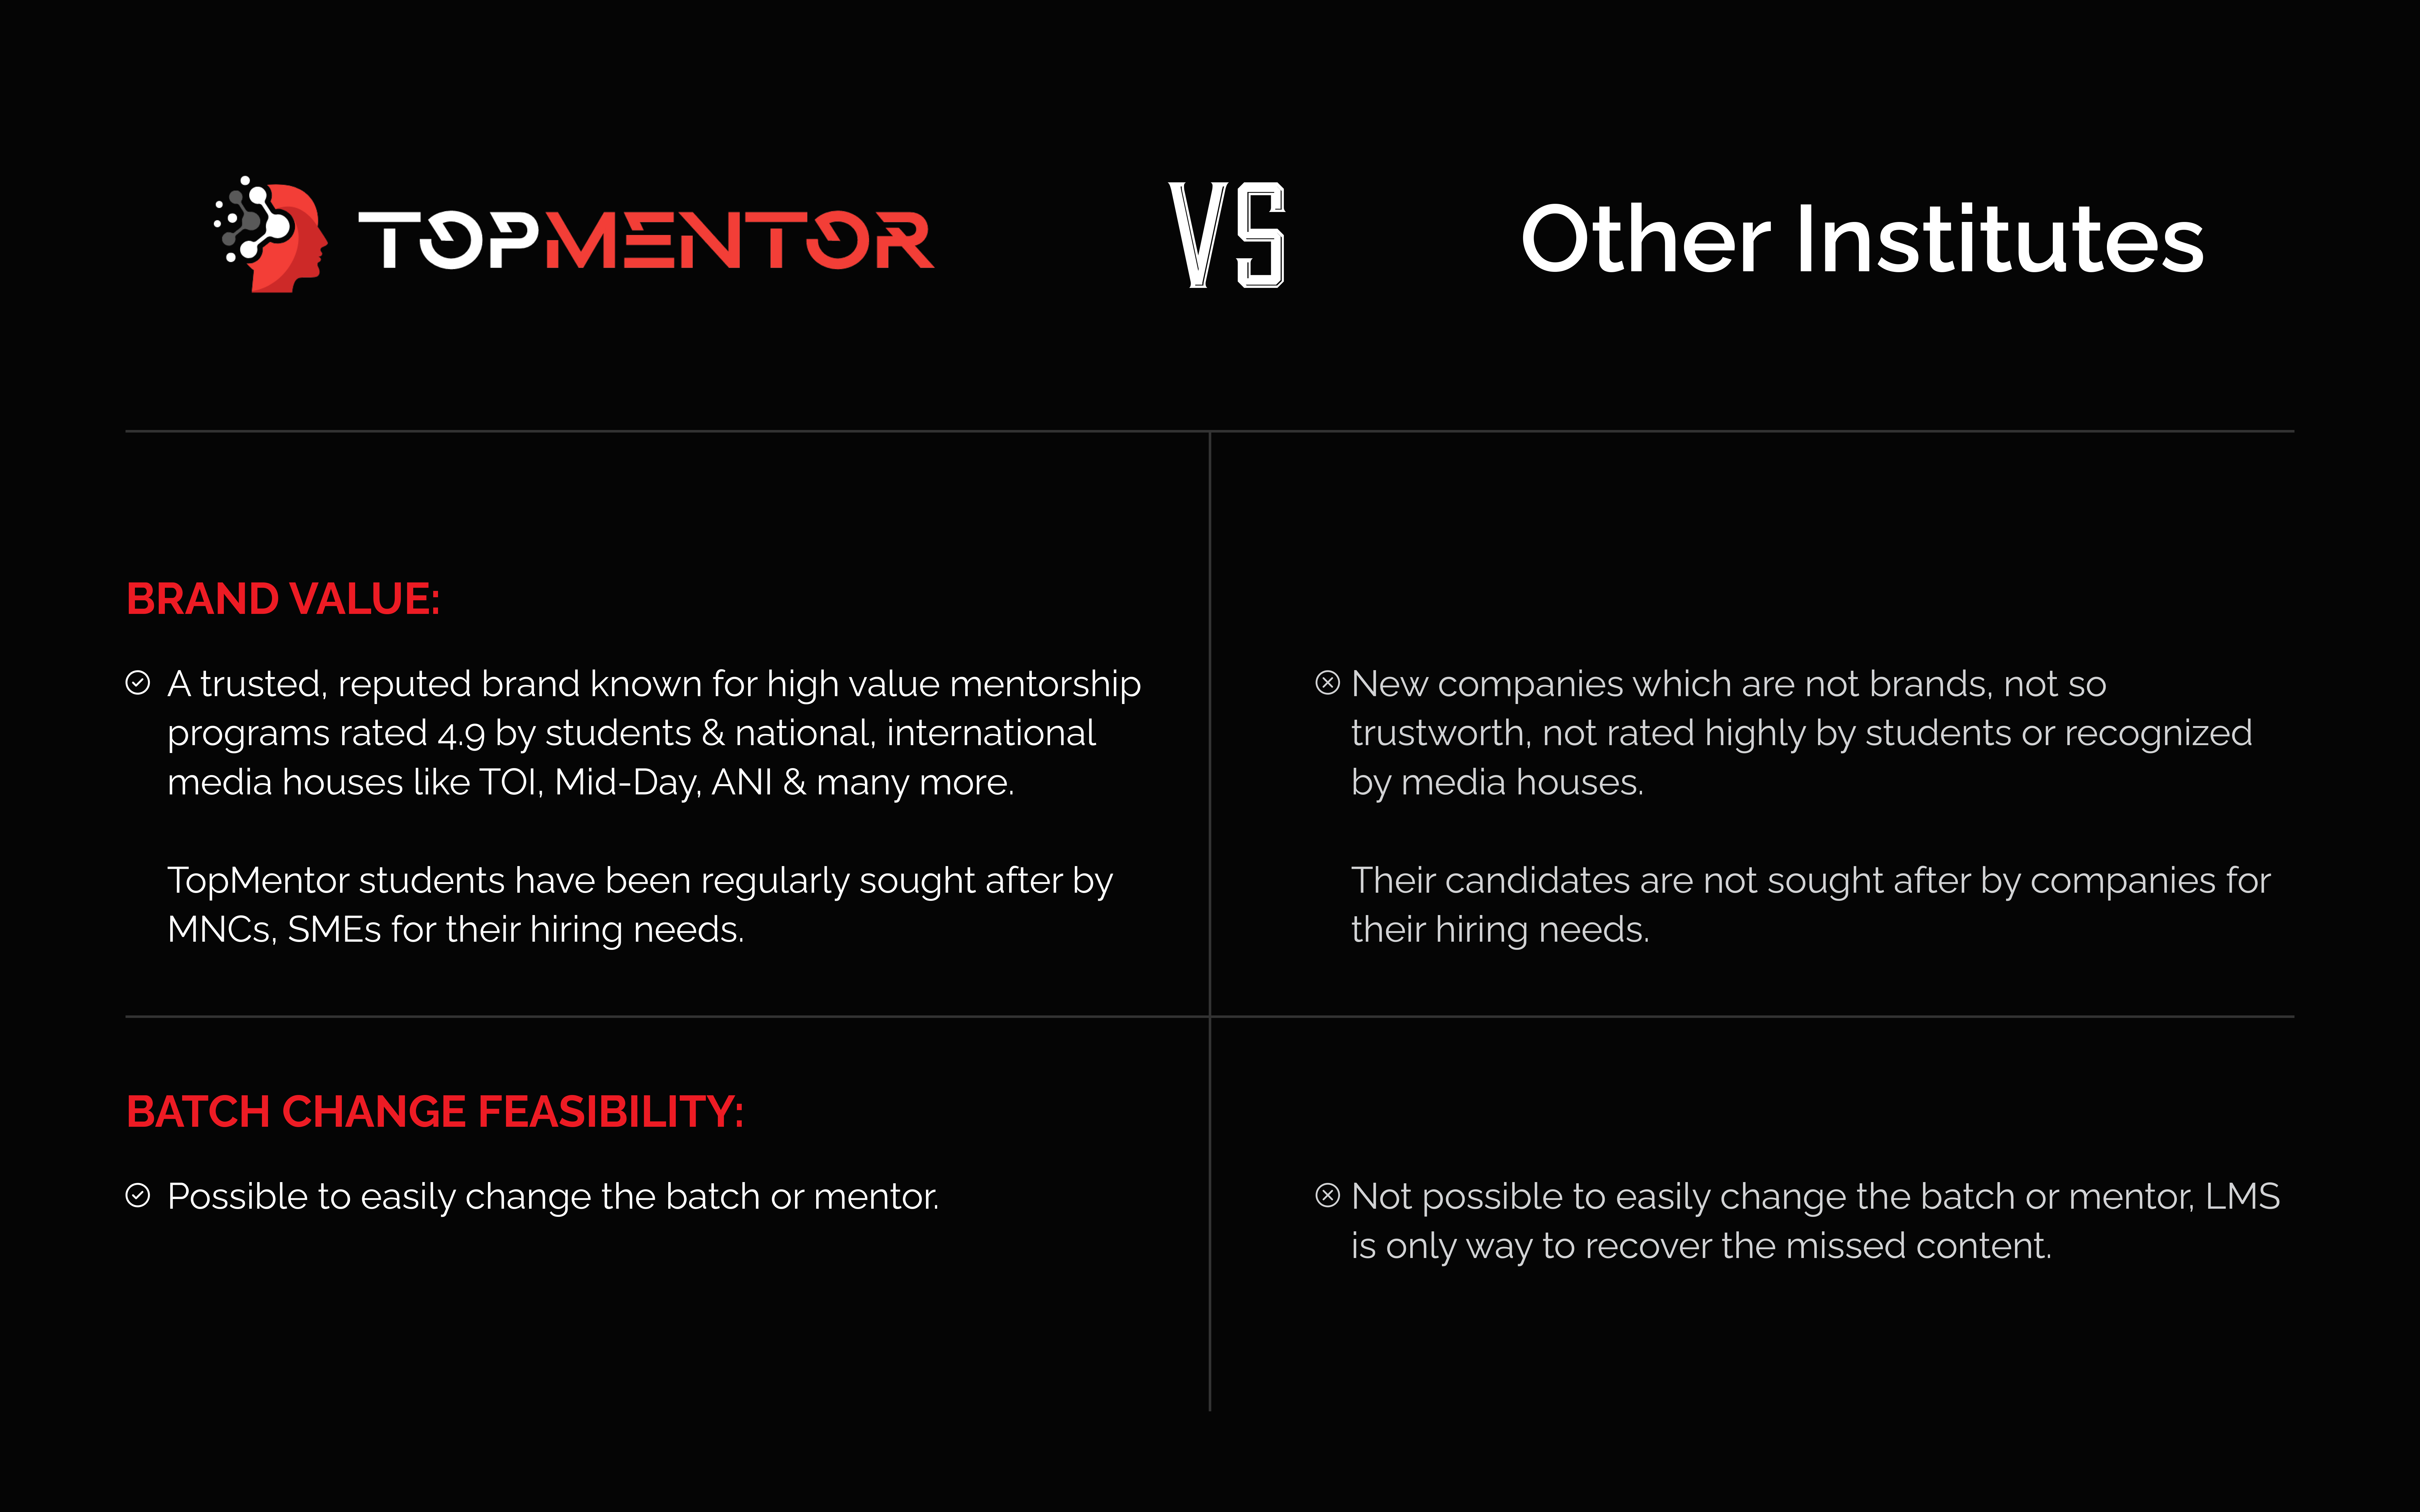
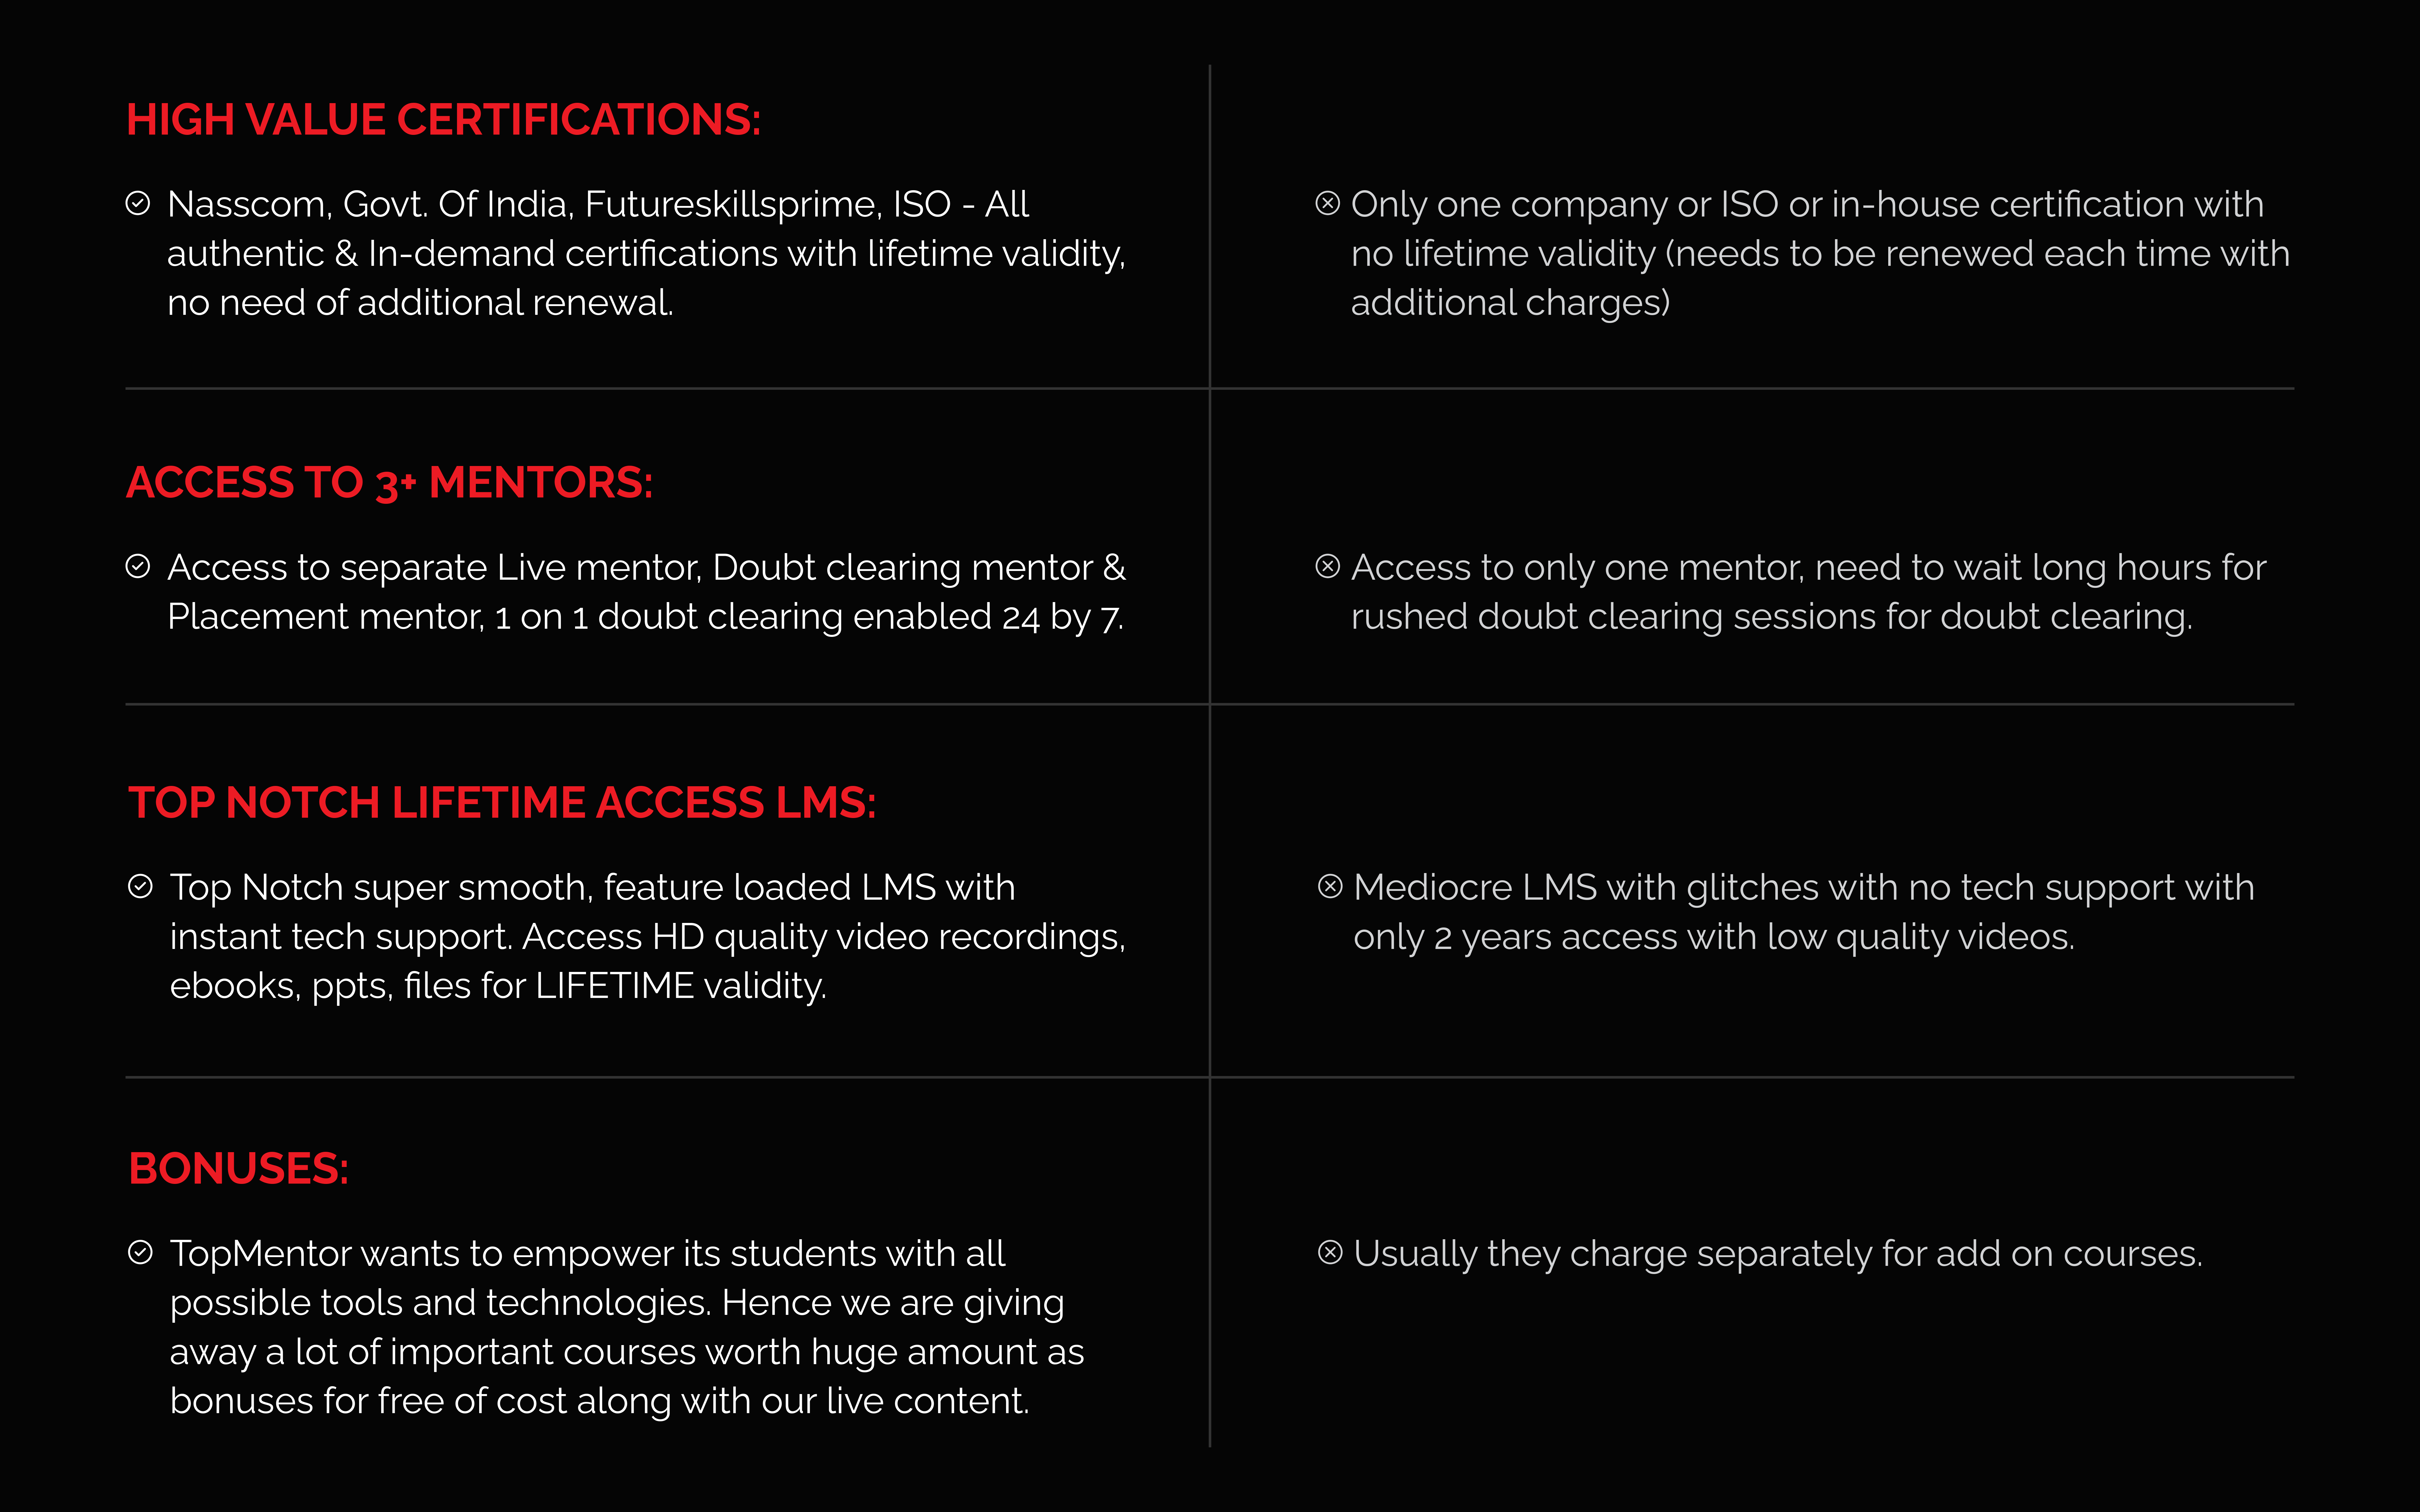
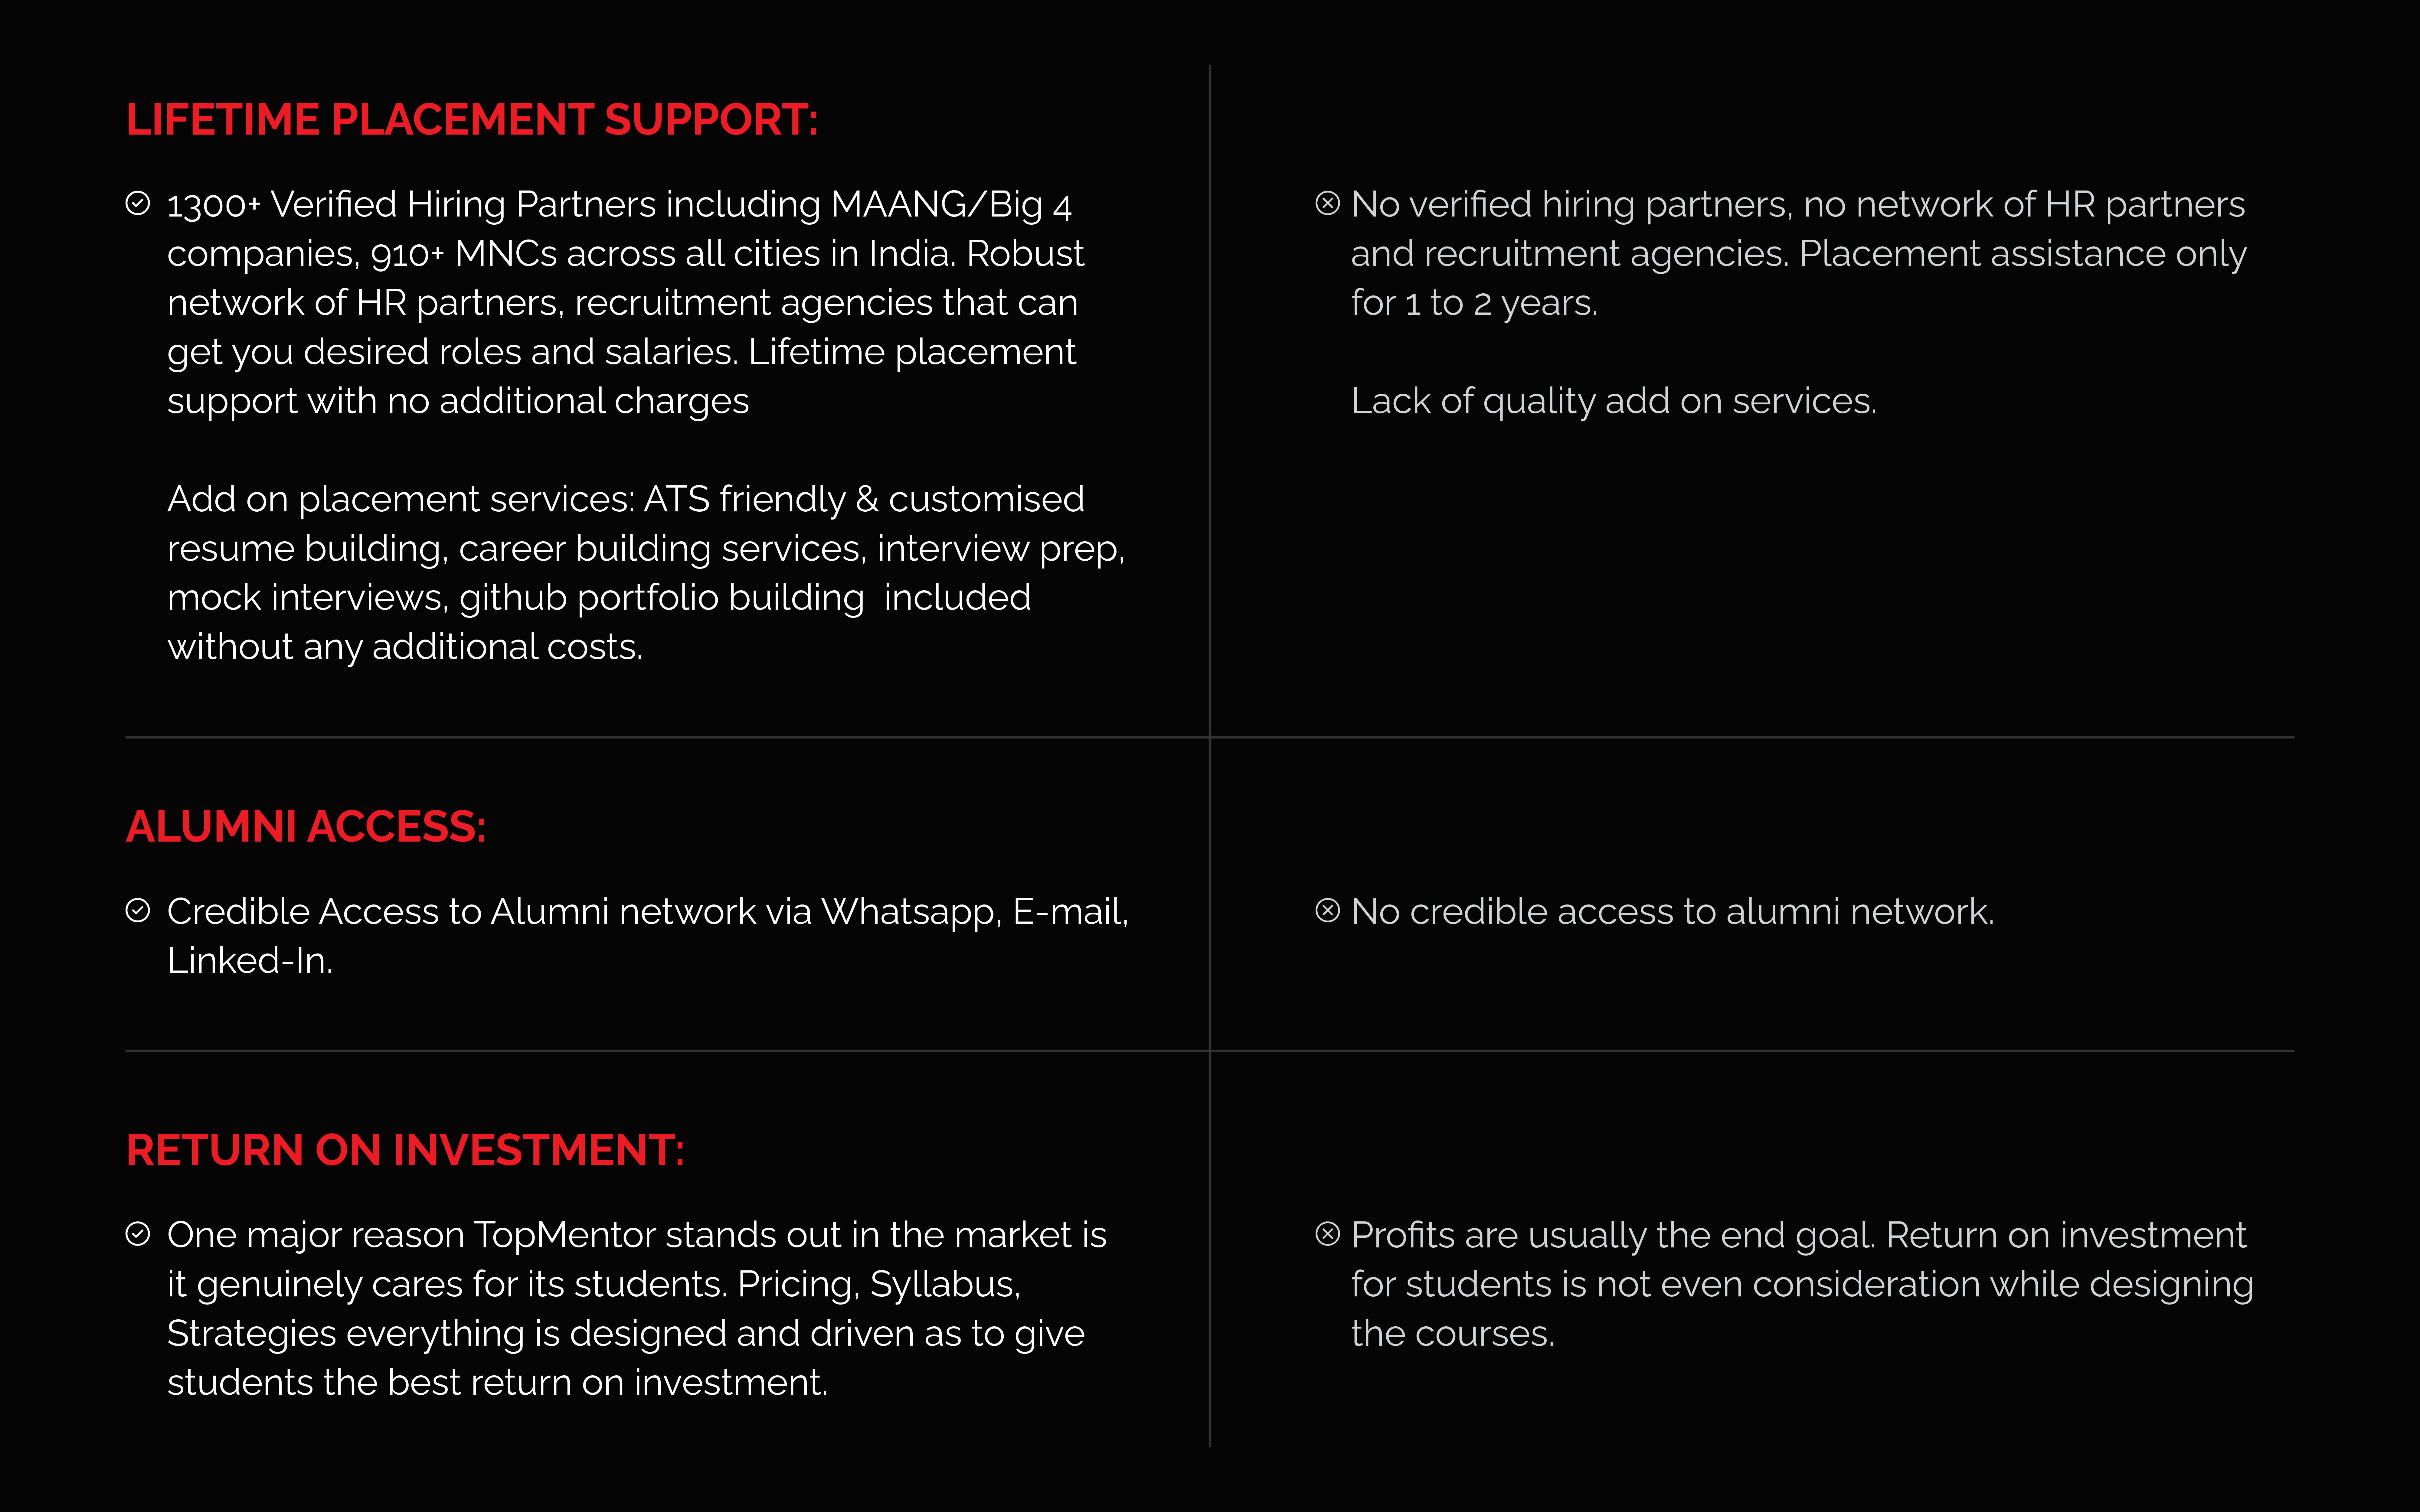
- Comparison Chart
Comparison Chart Between Topmentor and Other Institutes
Register Today to unlock Bonuses worth ₹ 200,000!
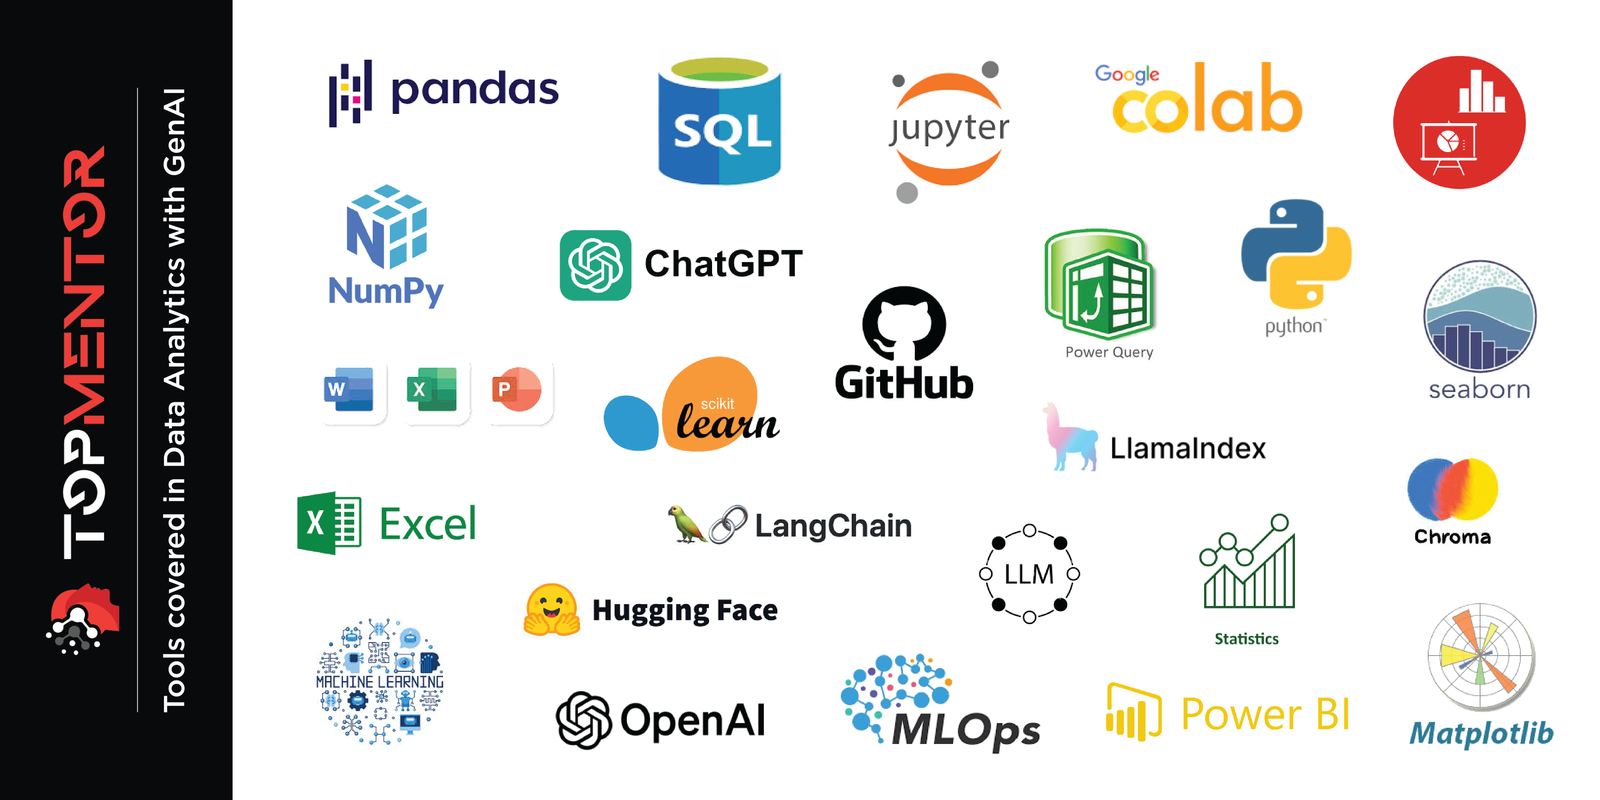
Some of the major contents covered in Data Analytics With GenAi Program:

Core Data Analytics
This part of data analytics training covers overview of data analytics. In addition, terminologies & applications within data science along with 3 excercizes.

Python For Data Analytics
Don’t know python? No worries – we got your back. We will teach right from basics of python so even if you don’t know python, you would still be able to make it.

Statistics For Data Analytics
Our instructor is a master statistician & will help you easily understand and master statistics even though you are not good with maths.
Predictive Modeling & Analytics
Training covers detailed practical process & execution. Master logical regressions, modeling. .Master Principles of Predictive analytics.

Machine Learning
Learn to create machine learning algorithms in python. Master making robust machine learning models & using them to solve any complex problems.

20+ Projects
Dive deep and practice real time on engaging visuals & capstone projects for your portfolio. Perfect for people without any prior oop knowledge.

Visualization With PowerBI
Master various features of Tableau & PowerBi. Create & design the visualizations for your audience. Learn to combine the data & practices to present your story

Data Science With R-programming
Master how to use R programming for data science, machine learning & visualization. Use R in data analysis, data manipulation, handle files & web scraping.

Deep Learning
If you wanna begin your deep learning journey then this course is great for you. It is designed in easiest way such that you don’t get bogged down unnecessarily.

SQL
Best way to learn SQL is by practicing it. Install free open source database & start writing and running simple queries using data. MYSQL is a free popular database that is compatible with most operating systems.

Jira
Jira is most widely used bug tracking and project management tool. If you follow any development methodology you can easily start using Jira in your project as it provides best customization possibilities.

Github
Github can easily be used as a collaboration platform among coders and can be used to build complex systems. As a beginner you should learn programing syntax first.
Register Today to unlock Bonuses worth ₹ 200,000+ !
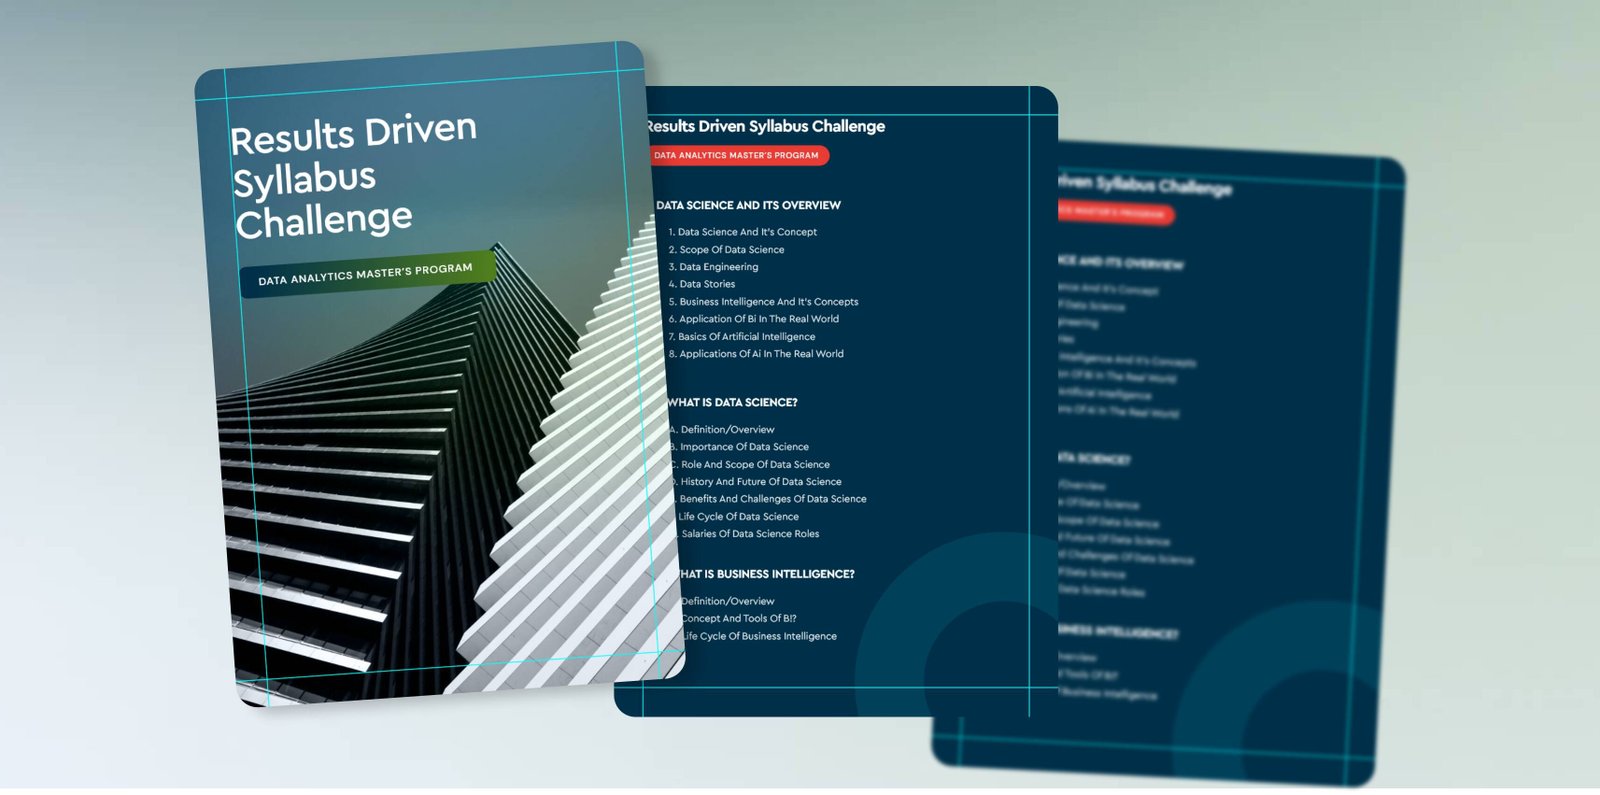
Syllabus that gets hired!
a. Introduction/Definition/overview of Data Analytics
b. Types of Analytics
c. Scope and Role of Analytics in Business
d. Fundamentals of Data
a. Sum-if & ifs
b. Average-if & ifs
c. Count-if & ifs
d. Lookup Function - VLOOKUP, HLOOKUP, XLOOKUP
e. Excel Shortcuts
a. Definition/Overview
b. How to Create a Pivot Table?
c. Data Analysis Using Pivot Table
d. Pivot Charts
e. Report Building and Filters in Pivot
a. Data Analysis
b. Correlation
c. Regression
d. Co-variance
e. Moving Average
f. Descriptive Stats
g. What-If Analysis
h. Goal Seek
I. Scenario Manager
j. Pivot Query
k. Loading Data
L. Transformations
m. Live Data Connection and Analysis.
a. Overview of Data
b. Types and Forms of Data
c. Applications and Examples of Data
d. Overview of Statistics
e. Types of Statistics - Applications and Examples
a. Overview of Descriptive Statistics
b. Functions in Descriptive Statistics - Applications and
Its Mathematical Explanation
i. Mean
ii. Median
iii. Mode
c. Standard Deviation
d. Skewness
e. Kurtosis
f. Range
g. Variance
h. Co-efficient Of Variation
I. Correlation
i. Pearson
ii. Spearman
j. Co-variance
k. Squared Error
L. Mean Squared Error, RMSE, MAD
m. Hands On Python/Excel
a. Overview of Inferential Statistics
b. Population and Sample
c. Test in Inferential Statistics
d. T-test
e. Chi-square
f. Anova
g. P-value
h. Tables and Critical value
I. Confidence Interval
j. Hands on in Python/Excel
a. What is Probability Distribution?
b. Examples and Applications of Probability Distribution
c. What are Normal Distributions?
d. What are Uniform Distributions?
e. What are Skewed Distributions?
f. What is a z-score?
g. Hands on in Python/Excel
a. Why we need Programming in Data Science
b. In which language can we do Programming?
c. Overview of Programming
d. What is Compiler and Interpreter?
a. Python Overview
b. Python Installations
c. Setting paths in Python
d. Coding with IDLE
e. Installing Editor - PyCharm/VS-Code
f. Setting interpreter
a. What is Anaconda?
b. Installations
c. Keywords and Identifiers in Python
d. Comments, Indentations and Statements
a. Integers
b. Strings
c. Float
d. Boolean
e. Bytes
a. Arithmetic Operators
b. Logical Operators
c. Membership operators
d. Equality Operators
e. Comparison Operators
a. If
b. If...... elseif
c. Loops -
d. For Loop
f. While Loop
g. Transfer Statements
h. Break
I. Continue.
j. Pass
a. Lists
b. Tuple
c. Sets
d. Dictionary
e. Range
a. Python Inbuilt Functions
b. Lambda Functions
c. User Defined Functions
d. Arguments in Functions
e. Modules in Python-
f. Math Module
g. Random Module
h. Exception Handling in Python
a. Overview of Pandas
b. Pandas Functions
c. Forms in Pandas
d. Data Frame Basics
e. Key Operations in Data Frame and Series
f. Data Analysis using Pandas
a. Introduction to NumPy
b. Introduction to Array
c. Numerical operations
a. Data Cleaning
b. Missing Values Handling
c. Handling categorical and Numerical Features
d. Outlier Detection and Imputation
e. Exploratory Data Analysis (EDA)
f. Decide Suitable Algorithms
g. Standard Scaler, Normalization, transformations
a. Introduction to matplotlib
b. Introduction to Seaborn
c. Introduction to Iris dataset and 2D scatterplot.
d. 3D scatterplot.
e. Pair plots.
f. Limitations for Pair plots.
g. Histogram and introduction to PDF (Probability Density Function).
h. Univariate analysis using PDF.
I. CDF (Cumulative Distribution Function)
j. Variance, Standard Deviation.
k. Median.
L. Percentiles and Quartiles.
m. IQR (Interquartile Range) Boxplot with whiskers
n. Violin plots.
i. Heatmaps and Correlations Plots
ii. Regression Plots
iii. Line Plots
iv. Pie Charts and Donut Charts in Python
a. Introduction to databases.
b. Why SQL?
c. Installing MySQL.
d. Load Data.
e. Use, Describe, Show Table.
f. Select
g. Order By, Distinct.
h. Where Clause, Comparison Operators, NULL.
I. Logic Operators
j. Aggregate Functions: COUNT, MIN, MAX, AVG, SU
k. Group By.
L. Join and Natural Join.
m. Subqueries/Nested Queries/Inner Queries.
n. DML: INSERT.
o. DML: UPDATE, DELETE.
p. DML: CREATE, TABLE.
q. DDL: DROP TABLE, TRUNCATE, DELETE.
r. Normalisation
s. Dimensional Modelling
t. Window Functions
i. SUM
ii. MAX
iii. Average
iv. Rank
v. Partition
vi. Order by
u. Views, Stored Procedures and Tables in MYSQL
v. Data Analysis and Data Wrangling In MYSQL
w. Temporary table creation
x. Database Administration
a. Introduction to Power BI - Need, Importance
b. Power BI - Advantages and Scalable Options
c. History - Power View, Power Query, Power Pivot
d. Power BI Architecture and Data Access
e. Power BI Desktop - Installation, Usage
f. Sample Reports and Visualization Controls
g. Understanding Desktop & Mobile Editions
a. Report Design with Legacy & .DAT Files
b. Report Design with Database Tables
c. Understanding Power BI Report Designer
d. Report Canvas, Report Pages: Creation, Renames
e. Report Visuals, Fields and UI Options
f. Experimenting Visual Interactions, Advantages
g. Reports with Multiple Pages and Advantages
h. Pages with Multiple Visualizations. Data Access
I. "GET DATA" Options and Report Fields, Filters
j. Report View Options: Full, Fit Page, Width Scale
k. Report Design using Databases & Queries
L. Query Settings and Data Preloads
m. Navigation Options and Report Refresh
n. Stacked bar chart, Stacked column chart
o. Clustered bar chart, Clustered column chart
p. Adding Report Titles. Report Format Options
q. Focus Mode, Explore and Export Settings
a. Power BI Design: Canvas, Visualizations and Fields
b. Import Data Options with Power BI Model, Advantages
c. Direct Query Options and Real-time (LIVE) Data Access
d. Data Fields and Filters with Visualizations
e. Visualization Filters, Page Filters, Report Filters
f. Conditional Filters and Clearing. Testing Sets
g. Creating Customised Tables with Power BI Editor
h. General Properties, Sizing, Dimensions, and Positions
I. Alternate Text and Tiles. Header (Column, Row) Properties
j. Grid Properties (Vertical, Horizontal) and Styles
k. Table Styles & Alternate Row Colors - Static, Dynamic
L. Sparse, Flashy Rows, Condensed Table Reports. Focus Mode
m. Totals Computations, Background. Borders Properties
n. Column Headers, Column Formatting, Value Properties
o. Conditional Formatting Options - Colour Scale
p. Page Level Filters and Report Level Filters
q. Visual-Level Filters and Format Options
r. Report Fields, Formats and Analytics
s. Page-Level Filters and Column Formatting, Filters
t. Background Properties, Borders and Lock Aspect
a. Chart report types and properties
b. Stacked bar chart, stacked column chart
c. Clustered bar chart, clustered column chart
d. 100% stacked bar chart, 100% stacked column chart
e. Line charts, area charts, stacked area charts
f. Line and stacked row charts
g. Line and stacked column charts
h. Waterfall chart, scatter chart, pie chart
I. Field Properties: Axis, Legend, Value, Tooltip
j. Field Properties: Colour Saturation, Filter Types
k. Formats: Legend, Axis, Data Labels, Plot Area
L. Data Labels: Visibility, Colour and Display Units
m. Data Labels: Precision, Position, Text Options
n. Analytics: Constant Line, Position, Labels
o. Working with Waterfall Charts and Default Values
p. Modifying Legends and Visual Filters - Options
q. Map Reports: Working with Map Reports
r. Hierarchies: Grouping Multiple Report Fields
s. Hierarchy Levels and Usages in Visualizations
t. Preordered Attribute Collection - Advantages
u. Using Field Hierarchies with Chart Reports
v. Direct Import and In-memory Loads, Advantages
a. Hierarchies and Drilldown Options
b. Hierarchy Levels and Drill Modes - Usage
c. Drill-thru Options with Tree Map and Pie Chart
d. Higher Levels and Next Level Navigation Options
e. Aggregates with Bottom/Up Navigations. Rules
f. Multi Field Aggregations and Hierarchies in Power BI
g. DRILLDOWN, SHOWNEXTLEVEL, EXPANDTONEXTLEVEL
h. SEE DATA and SEE RECORDS Options. Differences
I. Toggle Options with Tabular Data. Filters
j. Drilldown Buttons and Mouse Hover Options @ Visuals
k. Dependant Aggregations, Independent Aggregations
L. Automated Records Selection with Tabular Data
m. Report Parameters: Creation and Data Type
n. Available Values and Default values. Member Values
o. Parameters for Column Data and Table / Query Filters
p. Parameters Creation - Query Mode, UI Option
q. Linking Parameters to Query Columns - Options
r. Edit Query Options and Parameter Manage Entries
s. Connection Parameters and Dynamic Data Sources
a. Understanding Power Query Editor - Options
b. Power BI Interface and Query / Dataset Edits
c. Working with Empty Tables and Load / Edits
d. Empty Table Names and Header Row Promotions
e. Undo Headers Options. Blank Columns Detection
f. Data Imports and Query Marking in Query Editor
g. JSON Files & Binary Formats with Power Query
h. JavaScript Object Notation - Usage with M Lang.
I. Applied Steps and Usage Options. Revert Options
j. Creating Query Groups and Query References. Usage
k. Query Rename, Load Enable and Data Refresh Options
L. Combine Queries - Merge Join and Anti-Join Options
m. Combine Queries - Union and Union All as New Dataset
n. M Language: Nested Join and Join Kind Functions
o. REPLACE, REMOVE ROWS, REMOVE COL, BLANK - M Lang
p. Column Splits and Filled Up / Filled Down Options
q. Query Hide and Change Type Options. Code Generation
a. Purpose of Data Analysis Expressions (DAX)
b. Scope of Usage with DAX. Usability Options
c. DAX Context: Row Context and Filter Context
d. DAX Entities: Calculated Columns and Measures
e. DAX Data Types: Numeric, Boolean, Variant, Currency
f. Datetime Data Tye with DAX. Comparison with Excel
g. DAX Operators & Symbols. Usage. Operator Priority
h. Parenthesis, Comparison, Arithmetic, Text, Logic
I. DAX Functions and Types: Table Valued Functions
j. Filter, Aggregation and Time Intelligence Functions
k. Information Functions, Logical, Parent-Child Functions
L. Statistical and Text Functions. Formulas and Queries
m. Syntax Requirements with DAX. Differences with Excel
n. Naming Conventions and DAX Format Representation
o. Working with Special Characters in Table Names
p. Attribute / Column Scope with DAX - Examples
q. Measure / Column Scope with DAX – Examples
a. YTD, QTD, MTD Calculations with DAX
b. DAX Calculations and Measures
c. Using TOPN, RANKX, RANK.EQ
d. Computations using STDEV & VAR
e. SAMPLE Function, COUNTALL, ISERROR
f. ISTEXT, DATEFORMAT, TIMEFORMAT
g. Time Intelligence Functions with DAX
h. Data Analysis Expressions and Functions
I. DATESYTD, DATESQTD, DATESMTD
j. ENDOFYEAR, ENDOFQUARTER,ENDOFMONTH
k. FIRSTDATE, LASTDATE, DATESBETWEEN
L. CLOSINGBALANCEYEAR,CLOSINGBALANCEQTR
m. SAMEPERIOD and PREVIOUSMONTH,QUARTER
n. IF..ELSEIF.. Conditions with DAX
o. Slicing and Dicing Options with Columns, Measures
p. DAX for Query Extraction, Data Mashup Operations
q. Calculated Columns and Calculated Measures with DAX
a. PowerBI Report Validation and Publish
b. Understanding PowerBI Cloud Architecture
c. Data Refresh with Power BI Architecture
d. PBIX and PBIT Files with Power BI - Usage
e. Visual Data Imports and Visual Schemas
a. Relationships
b. Joins and Cardinality
c. Snowflake Schema
d. Star Schema in Power BI
a. Tokenization
b. Data Cleaning – Trimming, Case Conversion, Imputations, Removing.
a. What are LLMs?
b. Evolution of Natural Language Processing
c. How does an LLM outputs a word?
d. Next Word Prediction
e. Training and using LLMs
f. Ways to use LLMs: - Text Response and Embeddings
g. LLM Embeddings
h. Sentiment Analysis with LLMs
I. Serendipity in LLMs
j. How are LLMs revolutionizing industries today?
a. Study of GPT architecture and variants.
b. Applications of GPT models in text generation and dialogue systems.
c. Case study-based implementation of GPT-based tasks. GPT-based
chatbot enhances E-Shop's customer support service or any other use case.
a. Introduction to Vector Databases
b. Architecture of Vector Databases
c. Indexing Techniques
d. Distance Metrics and Similarity Measures
e. Nearest Neighbour Search
f. Open-Source Vector Databases: - Chroma and Milvus
a. Attention Mechanism
b. Transformer Architecture and components
c. GPT Architecture
d. GPT Training Process: - Pre-Training and Fine-Tuning
e. Building your own GPT from scratch using Open-Source API’s
a. Art of Prompt Engineering
a. Fine Tuning
b. Prompt Engineering
c. Text Summarizations.
d. Text Generation
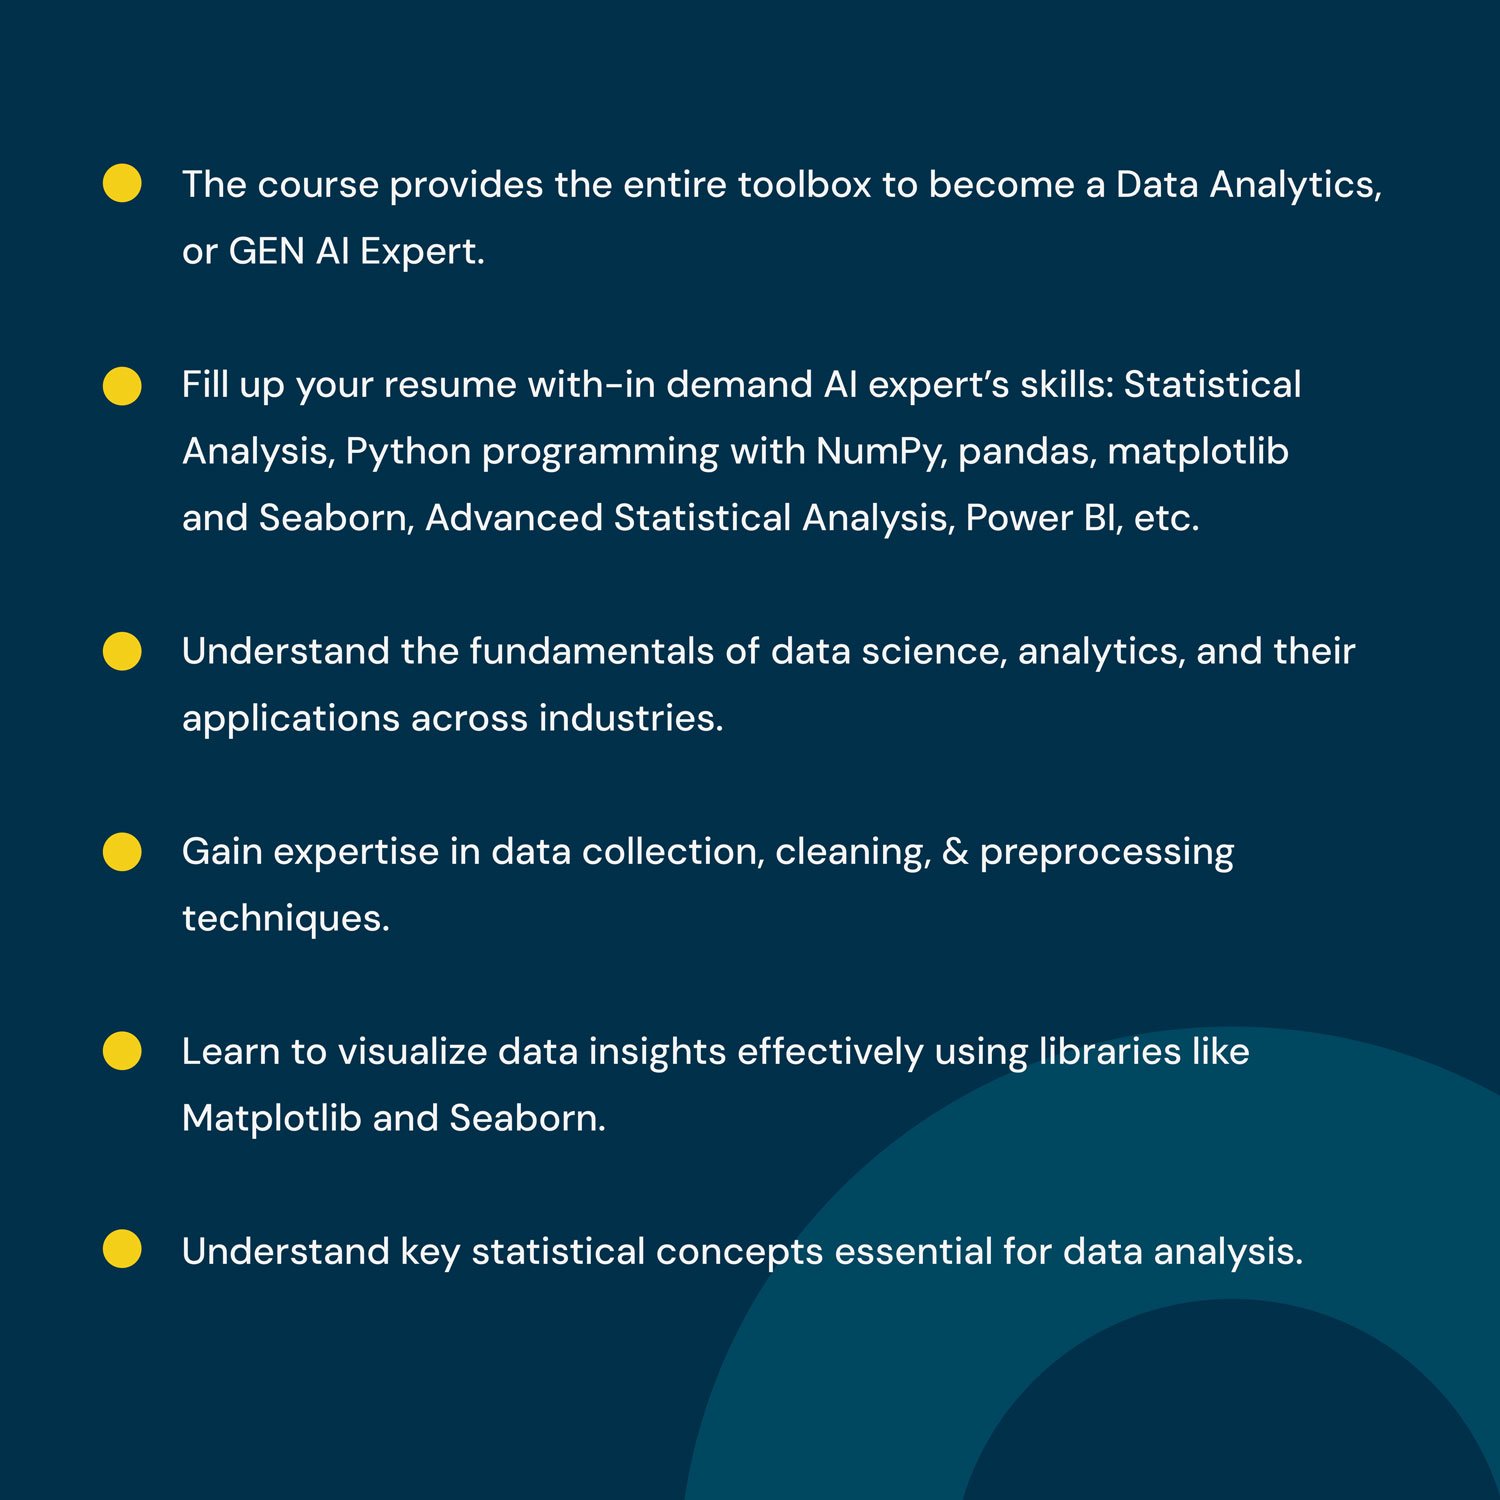
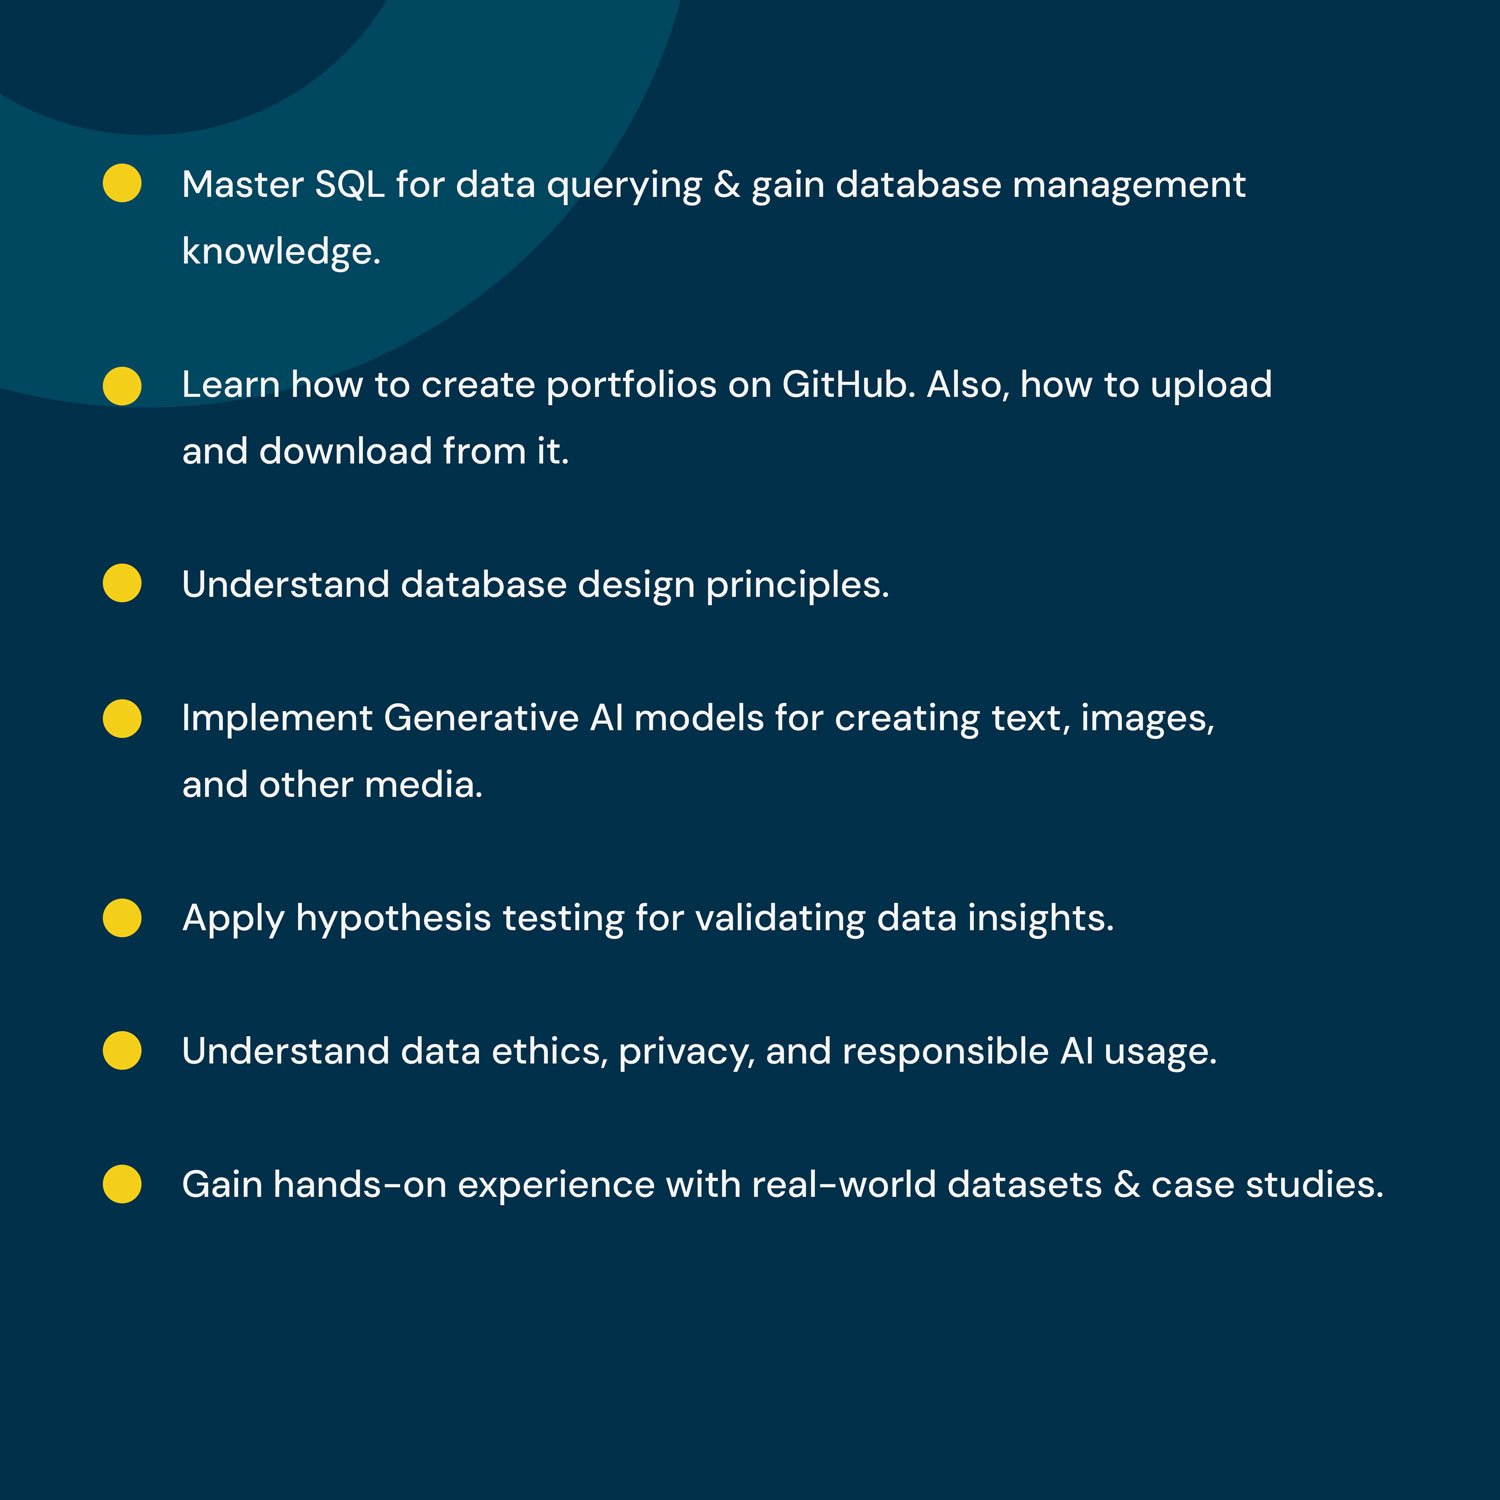
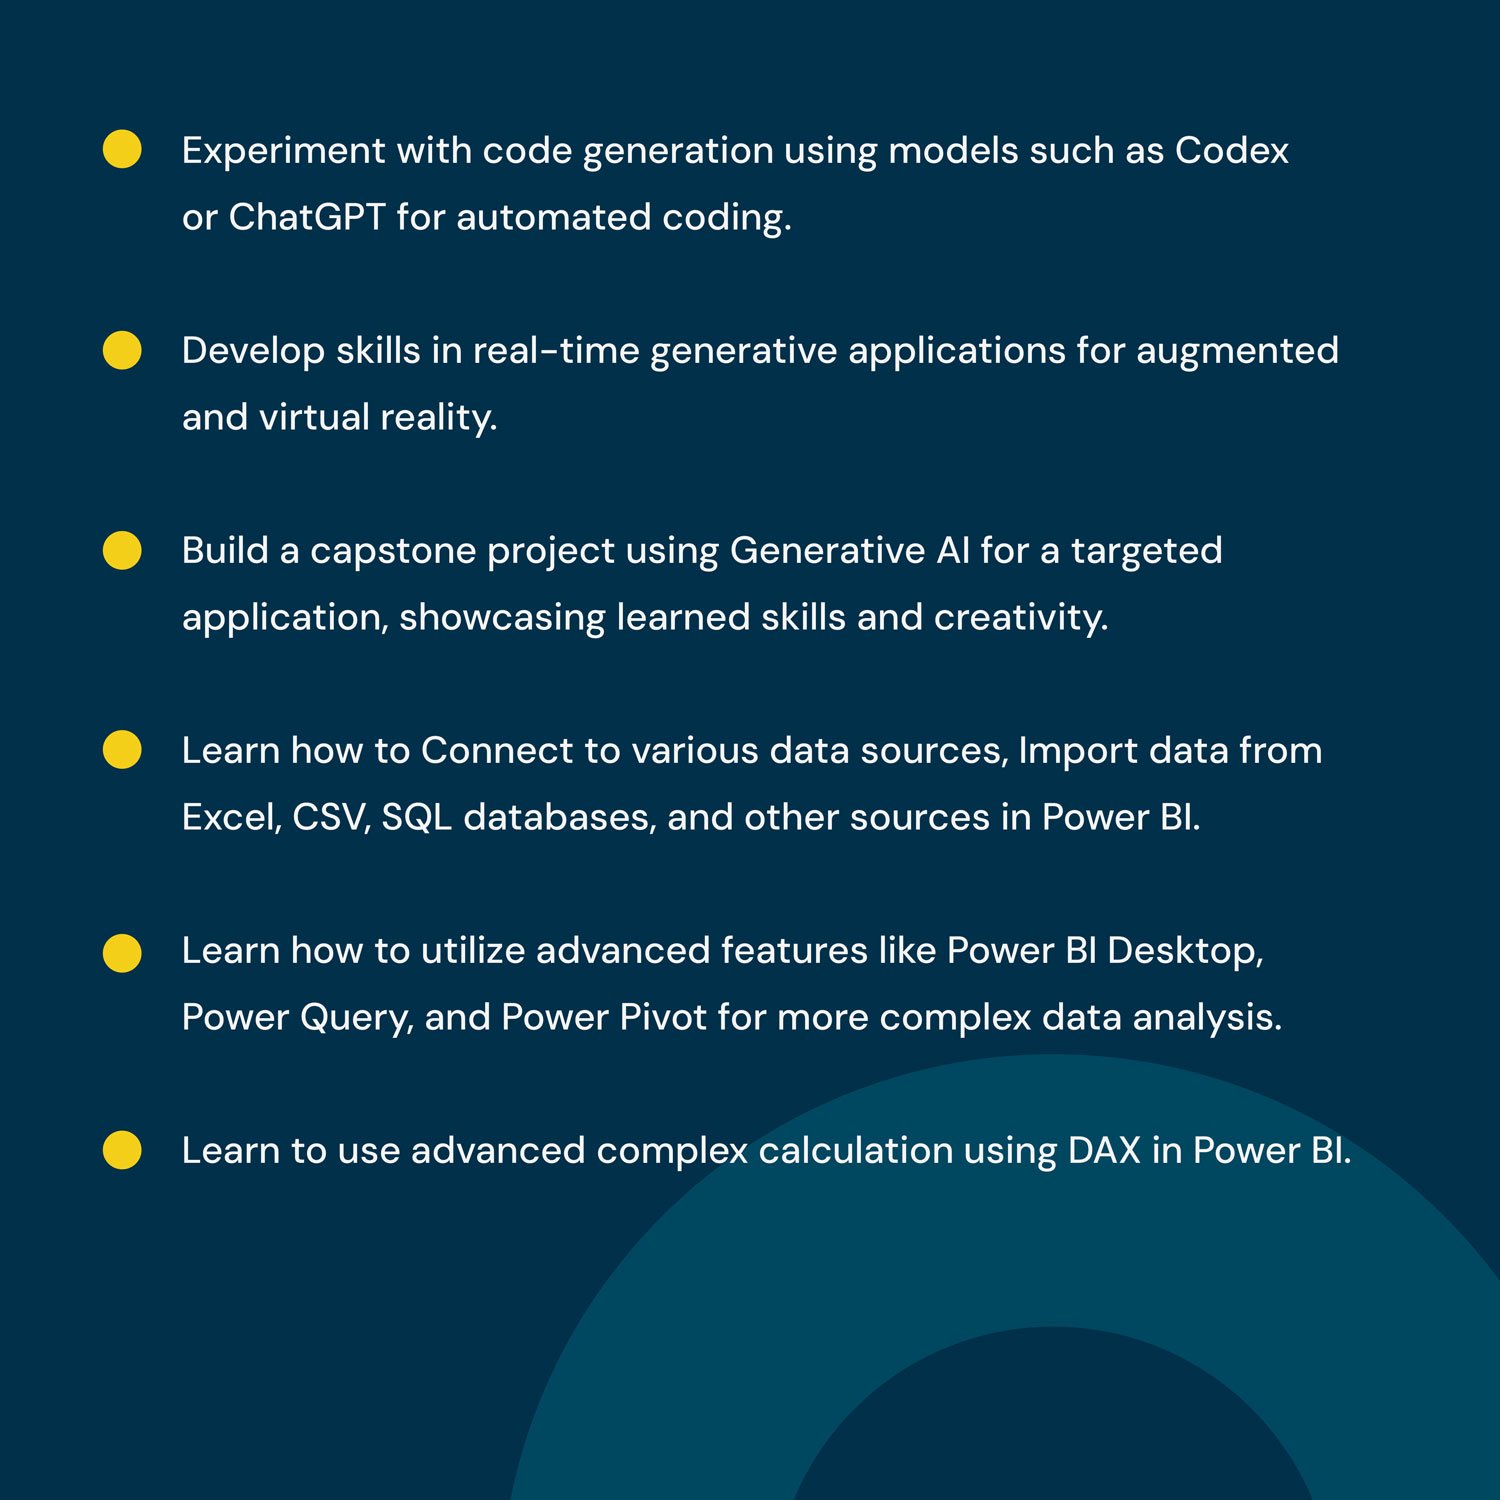
Learning Outcomes from Data Analytics with Genai program:



Register Today to unlock Bonuses worth ₹ 200,000+ !
Ultimate Learning Path of DA with GenAi program:

Register Today to unlock Bonuses worth ₹ 200,000+ !
Data Analytics is nothing but preparing data for analysis, processing that data, performing advanced data analysis and summing up results in such a way that will enable company owners and stakeholders to make informed decisions.
Data Analysts not only have a proper skills set but also have knowledge of different backgrounds like Mathematics, Analytics, Modelling, Statistics and have the ability to make good judgements and take quick decisions in business.
200K+
Demand for Data Analysts by 2026
17 Lacs+
Average Salary of Data Analyst in India
1 M+
Job postings on Indeed
32%
Projected increase in Data Analysts by 2026
The biggest advantage of working as a data analyst is that you can work in any industry, which can be sales, marketing, pharma, healthcare, consulting, finance, CPG, retails or any business which makes data driven decisions.
Data Scientist
Data Analyst
Business Analyst
Tableau Developer
Machine learning Engineer
R Developer
SQL Developer
Junior data Scientist
Research Analyst
Statistician
Data Engineer
Machine Learning Scientist
Data Architect
One on One Mentorship
The relationship is exclusively between one mentor and one mentee. An experienced senior mentor takes a junior mentee under their wing, sharing their wisdom, and expertise that help mentee solve doubts, problems faced during the program. This helps mentee progress faster
- 2X faster doubt resolution
- Build a relationship with mentor
- Learn from your mentor
- Find inspiration and support
Award Winning Learning Management System
Learn anytime, anywhere & track your progress.
- HD VIDEOS
- 24/7 LEARNING
- PROGRESS TRACKER
Leading MNCs and SMEs have preferred ‘Top Mentor’ for their needs of great industry ready professionals.
Best Data Analytics Course In India Review
Top Mentor is the best institute for Data Analytics. They helped me to clear my basics and visualization tools very well.
Nithyashree, Engineering Student, Placed in EY
Best Data Analytics Course In India Review
It has been a fruitful journey with Top Mentor. I strongly recommend to join the Data Analytics course here at Top Mentor.
Rohan Parab, Placed in i3 company - Mumbai
Best Data Analytics Training In India Review
The teaching staff here is very supportive. Real time examples & practices are very helpful. I will definitely recommend Top Mentor.
Sadaf Ansari, Student
Best Data Analytics Training Institute In India Review
The course offered at Top Mentor is awesome. They cover each topic and they show us real time scenario of what's actually happening in the outside market. It is the best institute, I recommend it to anybody looking for Data Analytics.
Kunal Dhakate, Sales & Marketing | Data Scientist at KPMG Australia
Best Data Analytics Course In India Review
It has been a great deal of help from clearing my basics in Data Analytics and Data Visualization to landing up making a high end model. Top Mentor has given a great assistance. Please enroll yourself.
Arpita Basu, Master in Economics | Now Data Analyst HSBC Bank
Register Today to unlock Bonuses worth ₹ 200,000+ !
Confused while choosing an institute? Just because some are offering Trainers and some are offering Mentors?
Trainer
There is not much difference between a trainer and a teacher. In the corporate world, a teacher is known as a trainer.
The trainer’s job is not to motivate or make an employee or a student potentially active on a targeted task, the trainer is just to explore their knowledge about a particular subject which they are specialized in. A trainer will not give you the knowledge of what can happen on a practical project/live project because a trainer isn't able to find the best way in which you can learn the particular subject or skill or concept.
Like a teacher, a trainer will provide you an environment of a classroom like you got in school and college, where the trainer will stand by in front of you behind a table. So, as we know in the classroom some of us get to understand what the trainer says and some of us not, because of miscommunication between the trainer and you the points get may be skipped.
Mentor
Mentors provide you personal advice, counsel, and support with their experience of working on a project with practical examples. A mentor has far more information than a trainer because of their working status. A mentor can be more effective than a trainer. A mentor is not a full-time trainer like a trainer does. A mentor does his mentorship in their free time while they do not have other stuff to do.
Mentors stick to a commitment until the job is done. Mentors wait for the mentees to understand and complete the process, they do not rush the process until the mentee is able to complete the process on his/her own. Usually, the mentors and mentee develop their friendship when official relationships are not mandatory. Generally, a mentor is not much aware of the company’s goal and they are more concerned about the mentee’s personal goal.
At TopMentor, we only have mentors. Who are currently working as a professional in the industry. So, I bet you will never be disappointed during the class. There will be no option that you are not understanding or even incase you don’t understand, you can ask the mentor at any time and as soon as possible the mentor will reply to you and will solve your doubt you will have.
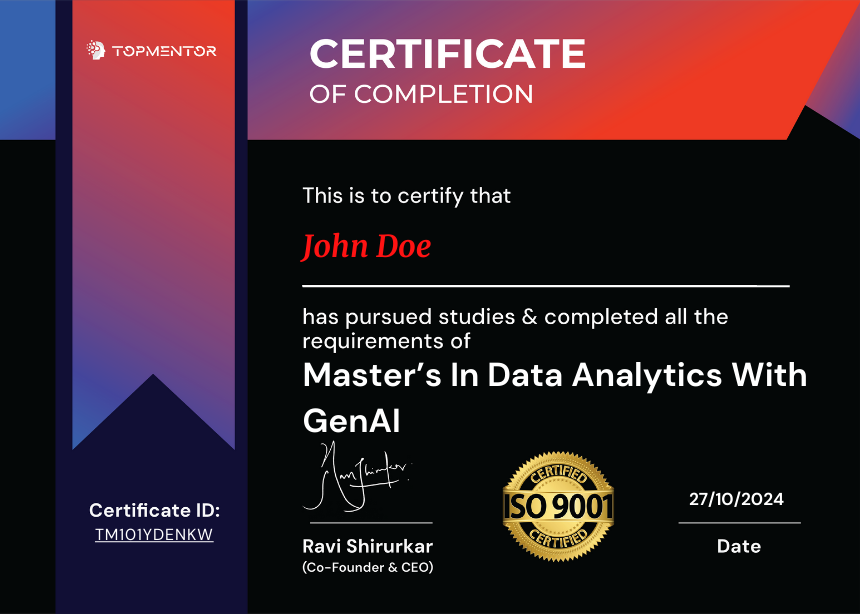
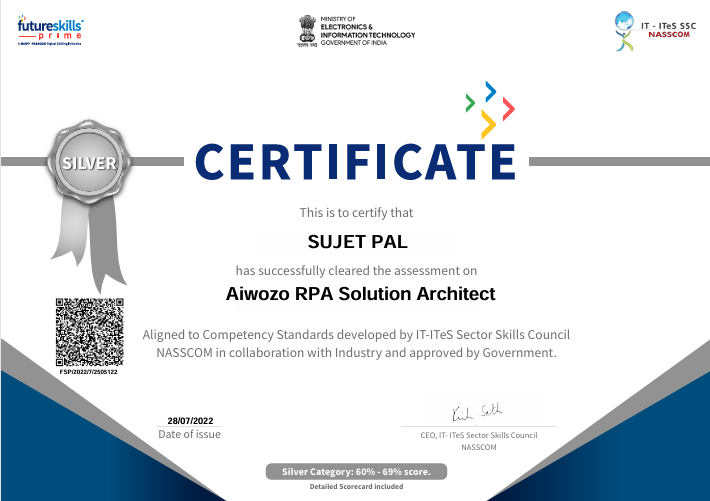
We are a Nasscom & Futureskillsprime approved company. We provide 13+ international certificates to students with their unique certificate ID. Every month out students find jobs in India and abroad with the help of these valuable international certifications.
We at TopMentor strongly recommend online learning for data science. In offline mode, students often miss classes due to emergencies and can't revisit them as exact same recordings are not available—but online courses provide class recordings, so you never fall behind. You can also learn from anywhere without settling for a nearby average institute. Plus, online sessions make it easier for shy students to ask doubts without hesitation. With industry mentors, flexible learning, and dedicated support, TopMentor offers one of the best online data science programs at the most affordable price.
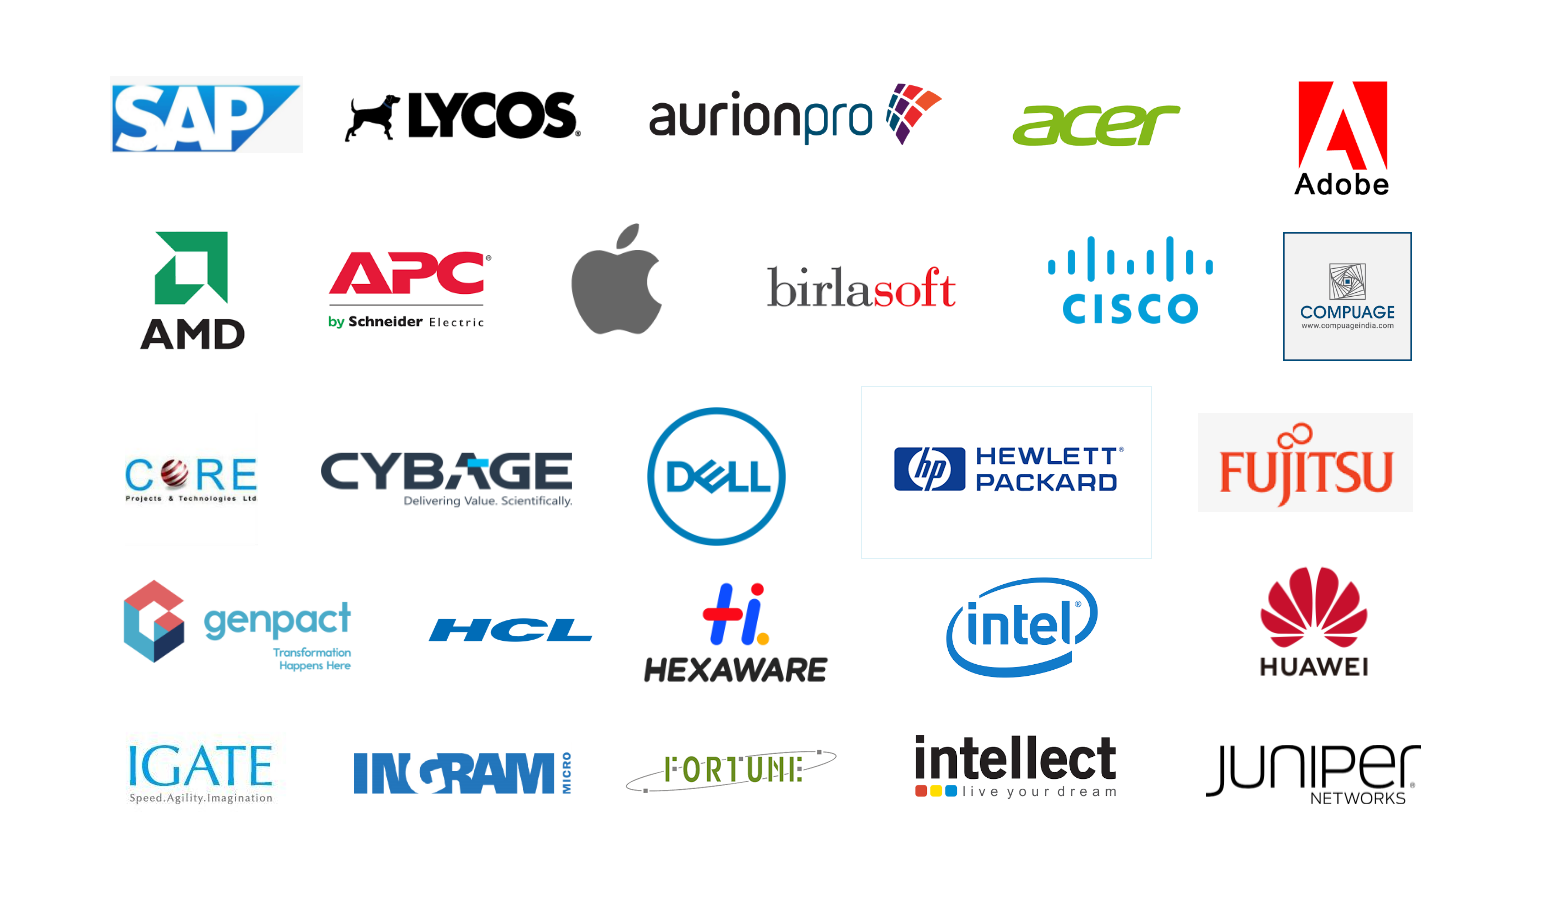
Have a look at some prestigious organizations, which are our major hiring partners.
Register Today to unlock Bonuses worth ₹ 200,000+ !
Frequently Asked Questions
There’s absolutely no eligibility for our data science mentorship program. There is NO need of having any previous coding, maths or even tech background. Anyone who wants to change and transform life and career should and can join the data science masters program with Top Mentor.
Yes absolutely, you will get 100% job assistance after the end of the course. We have tie ups with placement agencies, HR’s and companies with requirements in data analytics. It helps you get more interviews and easier placements. You will get placement calls from city of your choice.
As this page specifically talks about self paced version of course, there is no such duration. You can complete the content at your pace.
GetAdditional bonuses worth Rs. 200,000+
For Absolutely Free Of Cost When you opt for any Data/AI mentorship program
Get Additional bonuses worth Rs. 200,000+/-
For Absolutely Free Of Cost When you opt for any Data/AI mentorship program
Register Today to unlock Bonuses worth ₹ 200,000+ !
Media Talks About Us
We are featured in prestigious media publications.

Times of India
Best data science training institute/course in India with guaranteed placement opportunities : Top Mentor

Mid-day
Top Mentor sets highest placement standards by placing 550+ students in the last quarter.

Outlook Magazine
Become a Renowned Data Scientist With Topmentor's Mentorship Programs.

ANI News
TopMentor, an Edtech Startup becomes the goto place for professionals seeking jobs abroad.

Women Entrepreneur
Priyanka Pandharpurkar: Encouraging An Environment of Learning To Increase The Performance of Organisations

Indian Achievers Forum
Owing to the phenomenal placement records, TopMentor stands as a promising company in the edtech world.
Let Us Build Your Data Analytics Career Brighter.
Your Ticket To Become Highest Paid Data Analyst!
At TopMentor, your success is our mission. We provide lifetime career support — from ATS-ready resumes, guaranteed interview calls and exclusive job opportunities. With us, you’ll have expert guidance every step of the way, until you secure your dream role and beyond.
4.95/5
Top Mentor Proudly Trusted by 13221+ Students
Register Today to unlock Bonuses worth ₹ 200,000+ !
Let Us Build Your Data Analytics Career Brighter.
Your Ticket To Become Highest Paid Data Analyst!
No matter what your goal is – to get a job or be a great Data Analyst. We will do whatever in our powers to help it happen. Therefore, we are the best institute offering Data Analytics course in India due to our exceptional mentor-based approach.
Join India's best data science training course in India and learn from the top mentors in the industry. Enroll now and get started on your data analytics journey today!
100% Placement Assistance. Live Projects. Flexible Timings.
4.95/5
Top Mentor Proudly Trusted by 10,000+ Students
Data Analytics - Live Mentorship Program!
Fill the form now for the Best Data Analytics Training in India from a reputed Data Analytics institute – Top Mentor!


